Critical week packed with US CPI and central banks’ decisions: US dollar, AUD/USD, EUR/USD
Wall Street ended last Friday on a more subdued tone as some caution crept in ahead of a critical week packed with the release of US CPI and a series of central banks’ decisions.


Market Recap
Wall Street ended last Friday on a more subdued tone as some caution crept in ahead of a critical week packed with the release of US Consumer Price Index (CPI) figure and a series of central banks’ decisions, most notably the Federal Reserve (Fed). Previous Fed officials’ comments and pockets of weakness in economic conditions have led to broad expectations for the Fed to keep rates on hold at the upcoming meeting (70% probability), before resuming in July with an additional 25 basis-point (bp) move.
Fresh updates on the Fed’s economic projections will be on close watch as well. Previous inflation projection from the Fed is for core Personal Consumption Expenditures (PCE) Price Index to hit 3.6% by the end of this year. The most recent April reading stands at 4.7%, which showed little progress from January (4.7% as well) this year, therefore reflecting some risks that inflation projections from the Fed may be revised higher at the upcoming meeting and leaves a potential hawkish-pause scenario as the likely outcome.
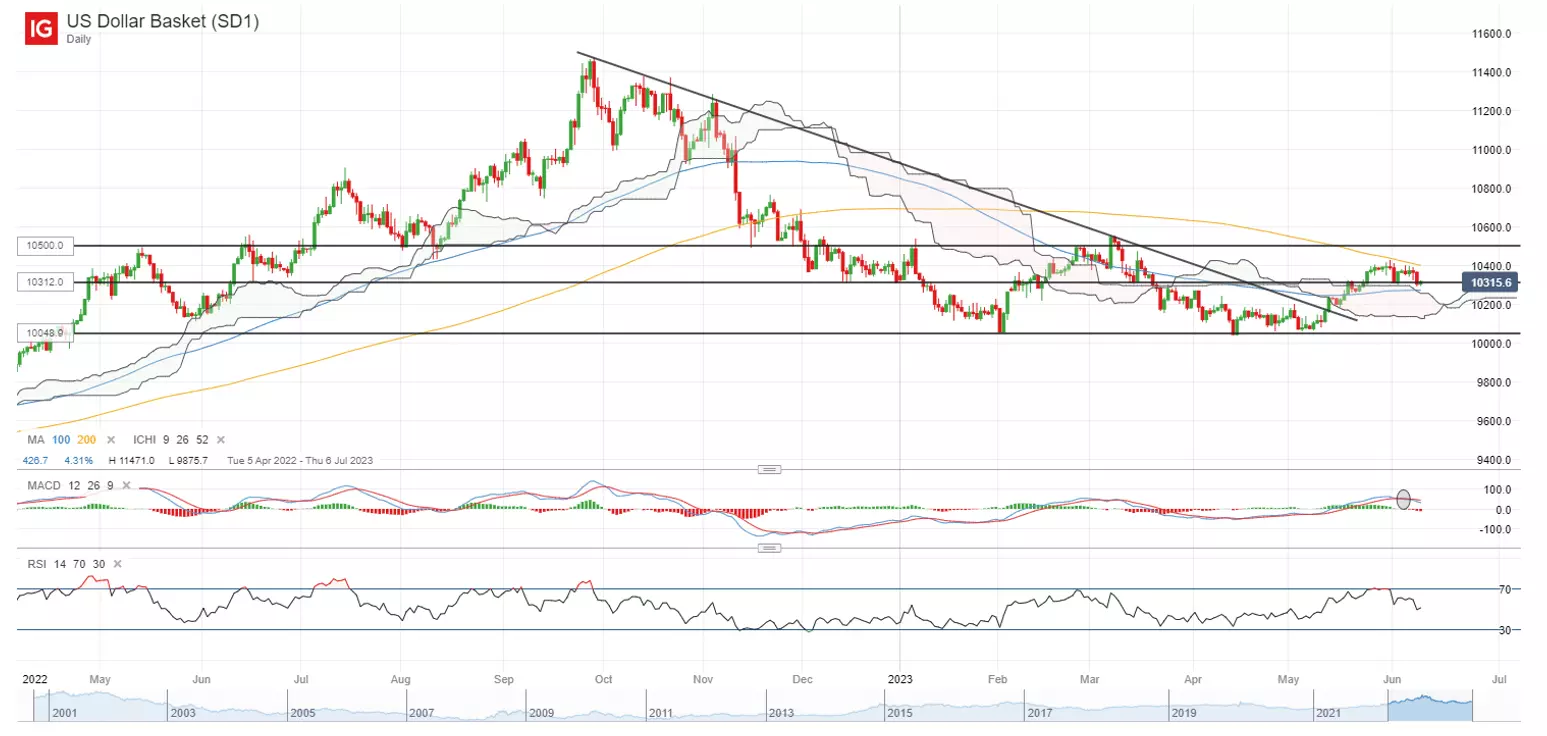
The two-year US Treasury yields are back to retest its three-month high, gaining 7 basis-point last Friday, while a more muted uptick was observed in the 10-year yields (+2 bp). The US dollar is back to retest its 103.12 level of support, with the lower highs reflecting some signs of exhaustion for now. Sustaining above this level may be key as it marked the 38.2% Fibonacci retracement of its May rally. Likewise, its Relative Strength Index (RSI) on the daily chart is back at its 50 level, and some defending of the key 50 line may be warranted to keep the near-term upward trend intact.
Asia Open
Asian stocks look set for a mixed open, with Nikkei +0.57%, KOSPI -0.11% and NZX -0.23% at the time of writing. Australian markets are closed for a holiday. The lead-up to the key US inflation data may prompt some wait-and-see, potentially pointing to a relatively low volume session, at least for now. The economic calendar saw the release of Japan’s Producer Price Index (PPI), with below-forecast readings (5.1% year-on-year versus 5.5% forecast) pointing to lesser cost pass-through to consumers and room for the Bank of Japan (BoJ) to maintain its accommodative stance for longer. Ahead, China’s new yuan loans data will be on watch for any sign of a stronger-than-expected bounce to provide a gauge for economic resilience.
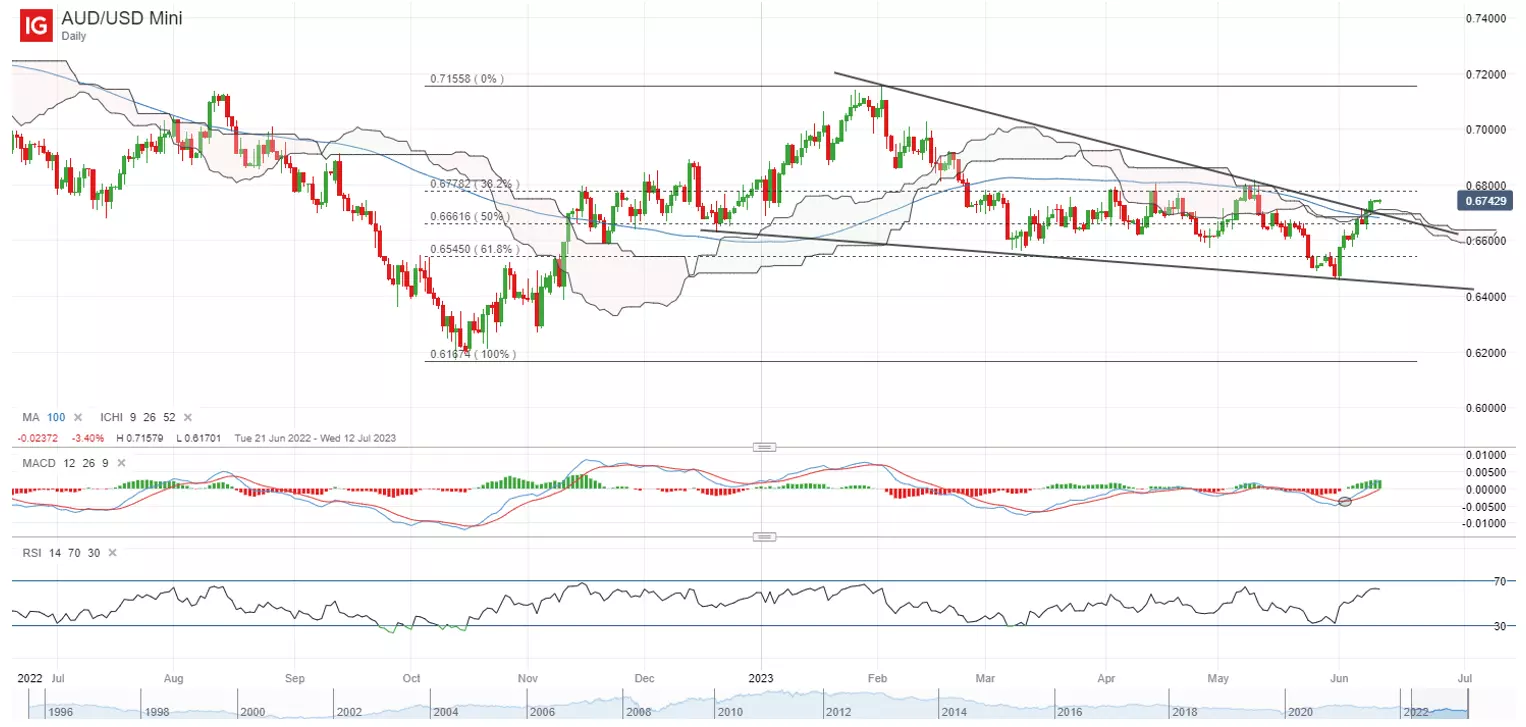
Aside, the AUD/USD has delivered its second straight week of gains, with a break above a downward trendline resistance to end last week. The pair is seemingly setting its sight on a retest of the 0.678 level next, where the pair has failed to cross on three occasions since April this year, leaving it as a key test of resistance ahead. Any successful move above the 0.678 level may potentially support a move towards the 0.691 level next.
On the watchlist: EUR/USD attempting to recover ahead of FOMC and ECB meeting
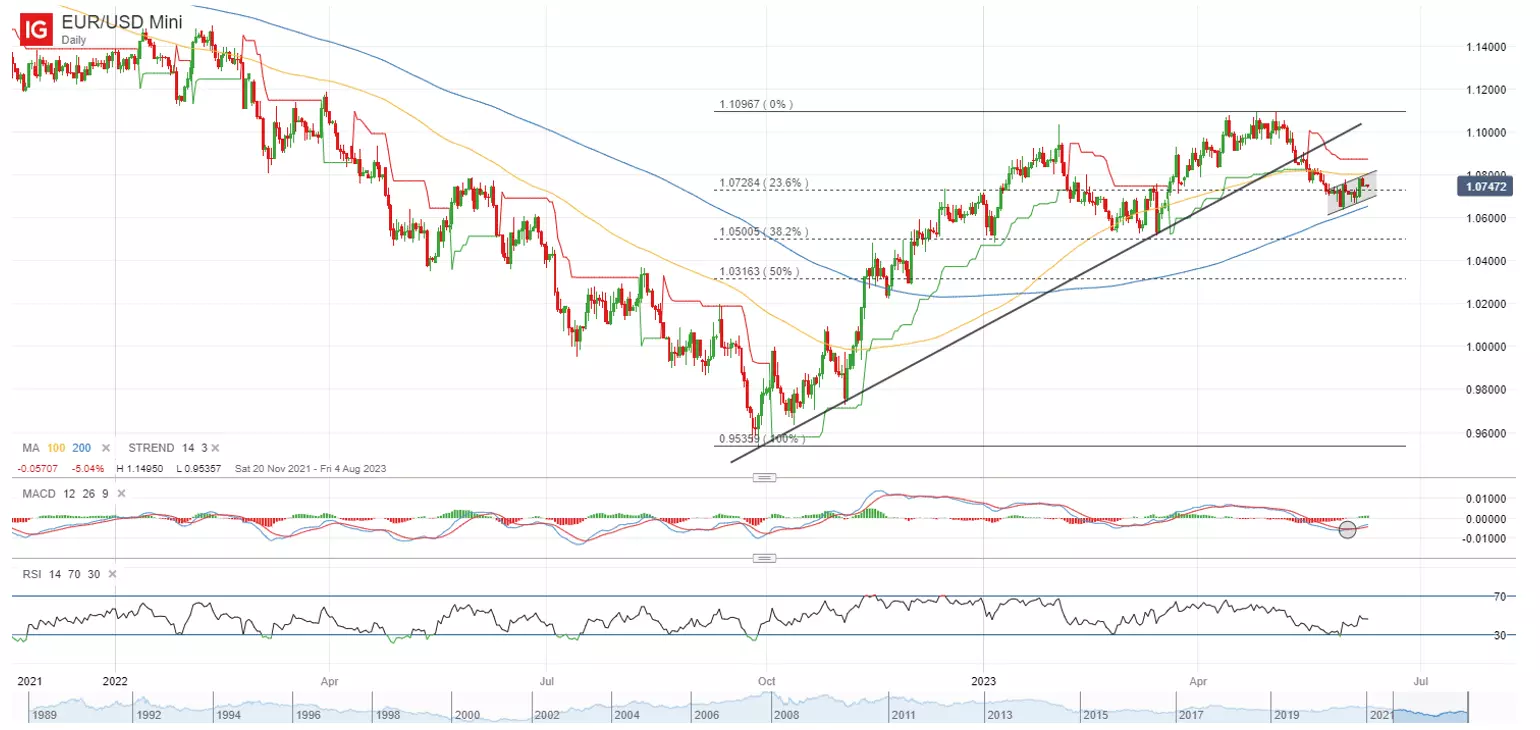
Following a 4% retracement since May this year, the EUR/USD has been attempting to edge higher in recent days, tapping on some exhaustion in the US dollar to turn in a two-week high last week. This week will bring about the Federal Open Market Committee (FOMC) and European Central Bank (ECB) meeting, with market rate expectations pricing for the Fed to execute a ‘rate skip’ for now but for the ECB to continue hiking through July, leaving the tone from the central banks on close watch to guide rate expectations for the rest of the year.
For now, a bullish crossover on moving average convergence/divergence (MACD) was formed on the daily chart but a reclaim of the 1.081 level may be warranted to provide greater conviction for the bulls. This level is where its 100-day moving average (MA) stands, which currently serves as a support-turned-resistance line following its breakdown in May this year.
Friday: DJIA +0.13%; S&P 500 +0.11%; Nasdaq +0.16%, DAX -0.25%, FTSE -0.49%
IGA, may distribute information/research produced by its respective foreign affiliates within the IG Group of companies pursuant to an arrangement under Regulation 32C of the Financial Advisers Regulations. Where the research is distributed in Singapore to a person who is not an Accredited Investor, Expert Investor or an Institutional Investor, IGA accepts legal responsibility for the contents of the report to such persons only to the extent required by law. Singapore recipients should contact IGA at 6390 5118 for matters arising from, or in connection with the information distributed.
The information/research herein is prepared by IG Asia Pte Ltd (IGA) and its foreign affiliated companies (collectively known as the IG Group) and is intended for general circulation only. It does not take into account the specific investment objectives, financial situation, or particular needs of any particular person. You should take into account your specific investment objectives, financial situation, and particular needs before making a commitment to trade, including seeking advice from an independent financial adviser regarding the suitability of the investment, under a separate engagement, as you deem fit.
No representation or warranty is given as to the accuracy or completeness of this information. Consequently, any person acting on it does so entirely at their own risk. Please see important Research Disclaimer.
Please also note that the information does not contain a record of our trading prices, or an offer of, or solicitation for, a transaction in any financial instrument. Any views and opinions expressed may be changed without an update.

Seize a share opportunity today
Go long or short on thousands of international stocks.
- Increase your market exposure with leverage
- Get spreads from just 0.1% on major global shares
- Trade CFDs straight into order books with direct market access
Live prices on most popular markets
- Forex
- Shares
- Indices
See more forex live prices
See more shares live prices
Prices above are subject to our website terms and agreements. Prices are indicative only. All shares prices are delayed by at least 15 mins.
See more indices live prices
Prices above are subject to our website terms and agreements. Prices are indicative only. All shares prices are delayed by at least 20 mins.
