Boeing’s share price: what to expect from Q2 results
Find out what to expect from Boeing’s earnings results, how they will affect Boeing share price, and how to trade Boeing’s earnings.


When is Boeing’s results date?
Boeing is expected to report its second quarter earnings on Wednesday, 28 July, before the market open.
Boeing share price: forecasts from Q2 results
The focus since the start of the year has been on the reflation and reopening trade, and while the second quarter (Q2) saw fresh record highs for the Wall Street, it hasn’t translated into price gains for Boeing, the aircraft manufacturer whose share price is hardly up since the start of the year and definitely down since the start of last quarter, and as of late an underperformer of the key index.
International travel, while picking up in comparison to last year remains tested globally, and more specifically in regions that have yet to fully re-open, and that’s not including current (or future) Covid-19 variants keeping lockdowns in place, or forcing governments into increasing restrictions.
There’s plenty to digest that’ll be factored into future earnings, as the latest hasn’t been positive for the airplane maker, cutting its delivery target for the 787 Dreamliner planes and reducing production rates temporarily on a new defect that will force it to spend more time on those within its inventory yet to be delivered. There’s also the partial cancellation of the 737 MAX order from flydubai.
The positives for the past quarter have been that deliveries have no doubt improved with the first half 156 planes, nearly the amount for all of last year, also picking up on the orders front thanks to the 270 order from United Airlines, 200 of which going to Boeing’s 737 MAX. Big orders don’t translate into bigger profit margins however and especially when significant bulk orders from a few key airlines gives the latter the negotiation power, a theme to note in what remains a tested industry that’s still very much vulnerable.
So what about the numbers?
Earnings per share (EPS) haven’t been positive since the last quarter of 2019, and that trend of negative figures look set to continue for an EPS reading averaged at -$0.72, not as bad as losses suffered in recent quarters, but a figure below zero nonetheless. And, there have been plenty of cases where actual numbers veered far from expectations. Revenue is expected to move higher from $15.2 billion to nearly $18 billion. Its share price is near the lower end of price targets from analysts, testing their majority buy recommendations (source: finance.yahoo.com).
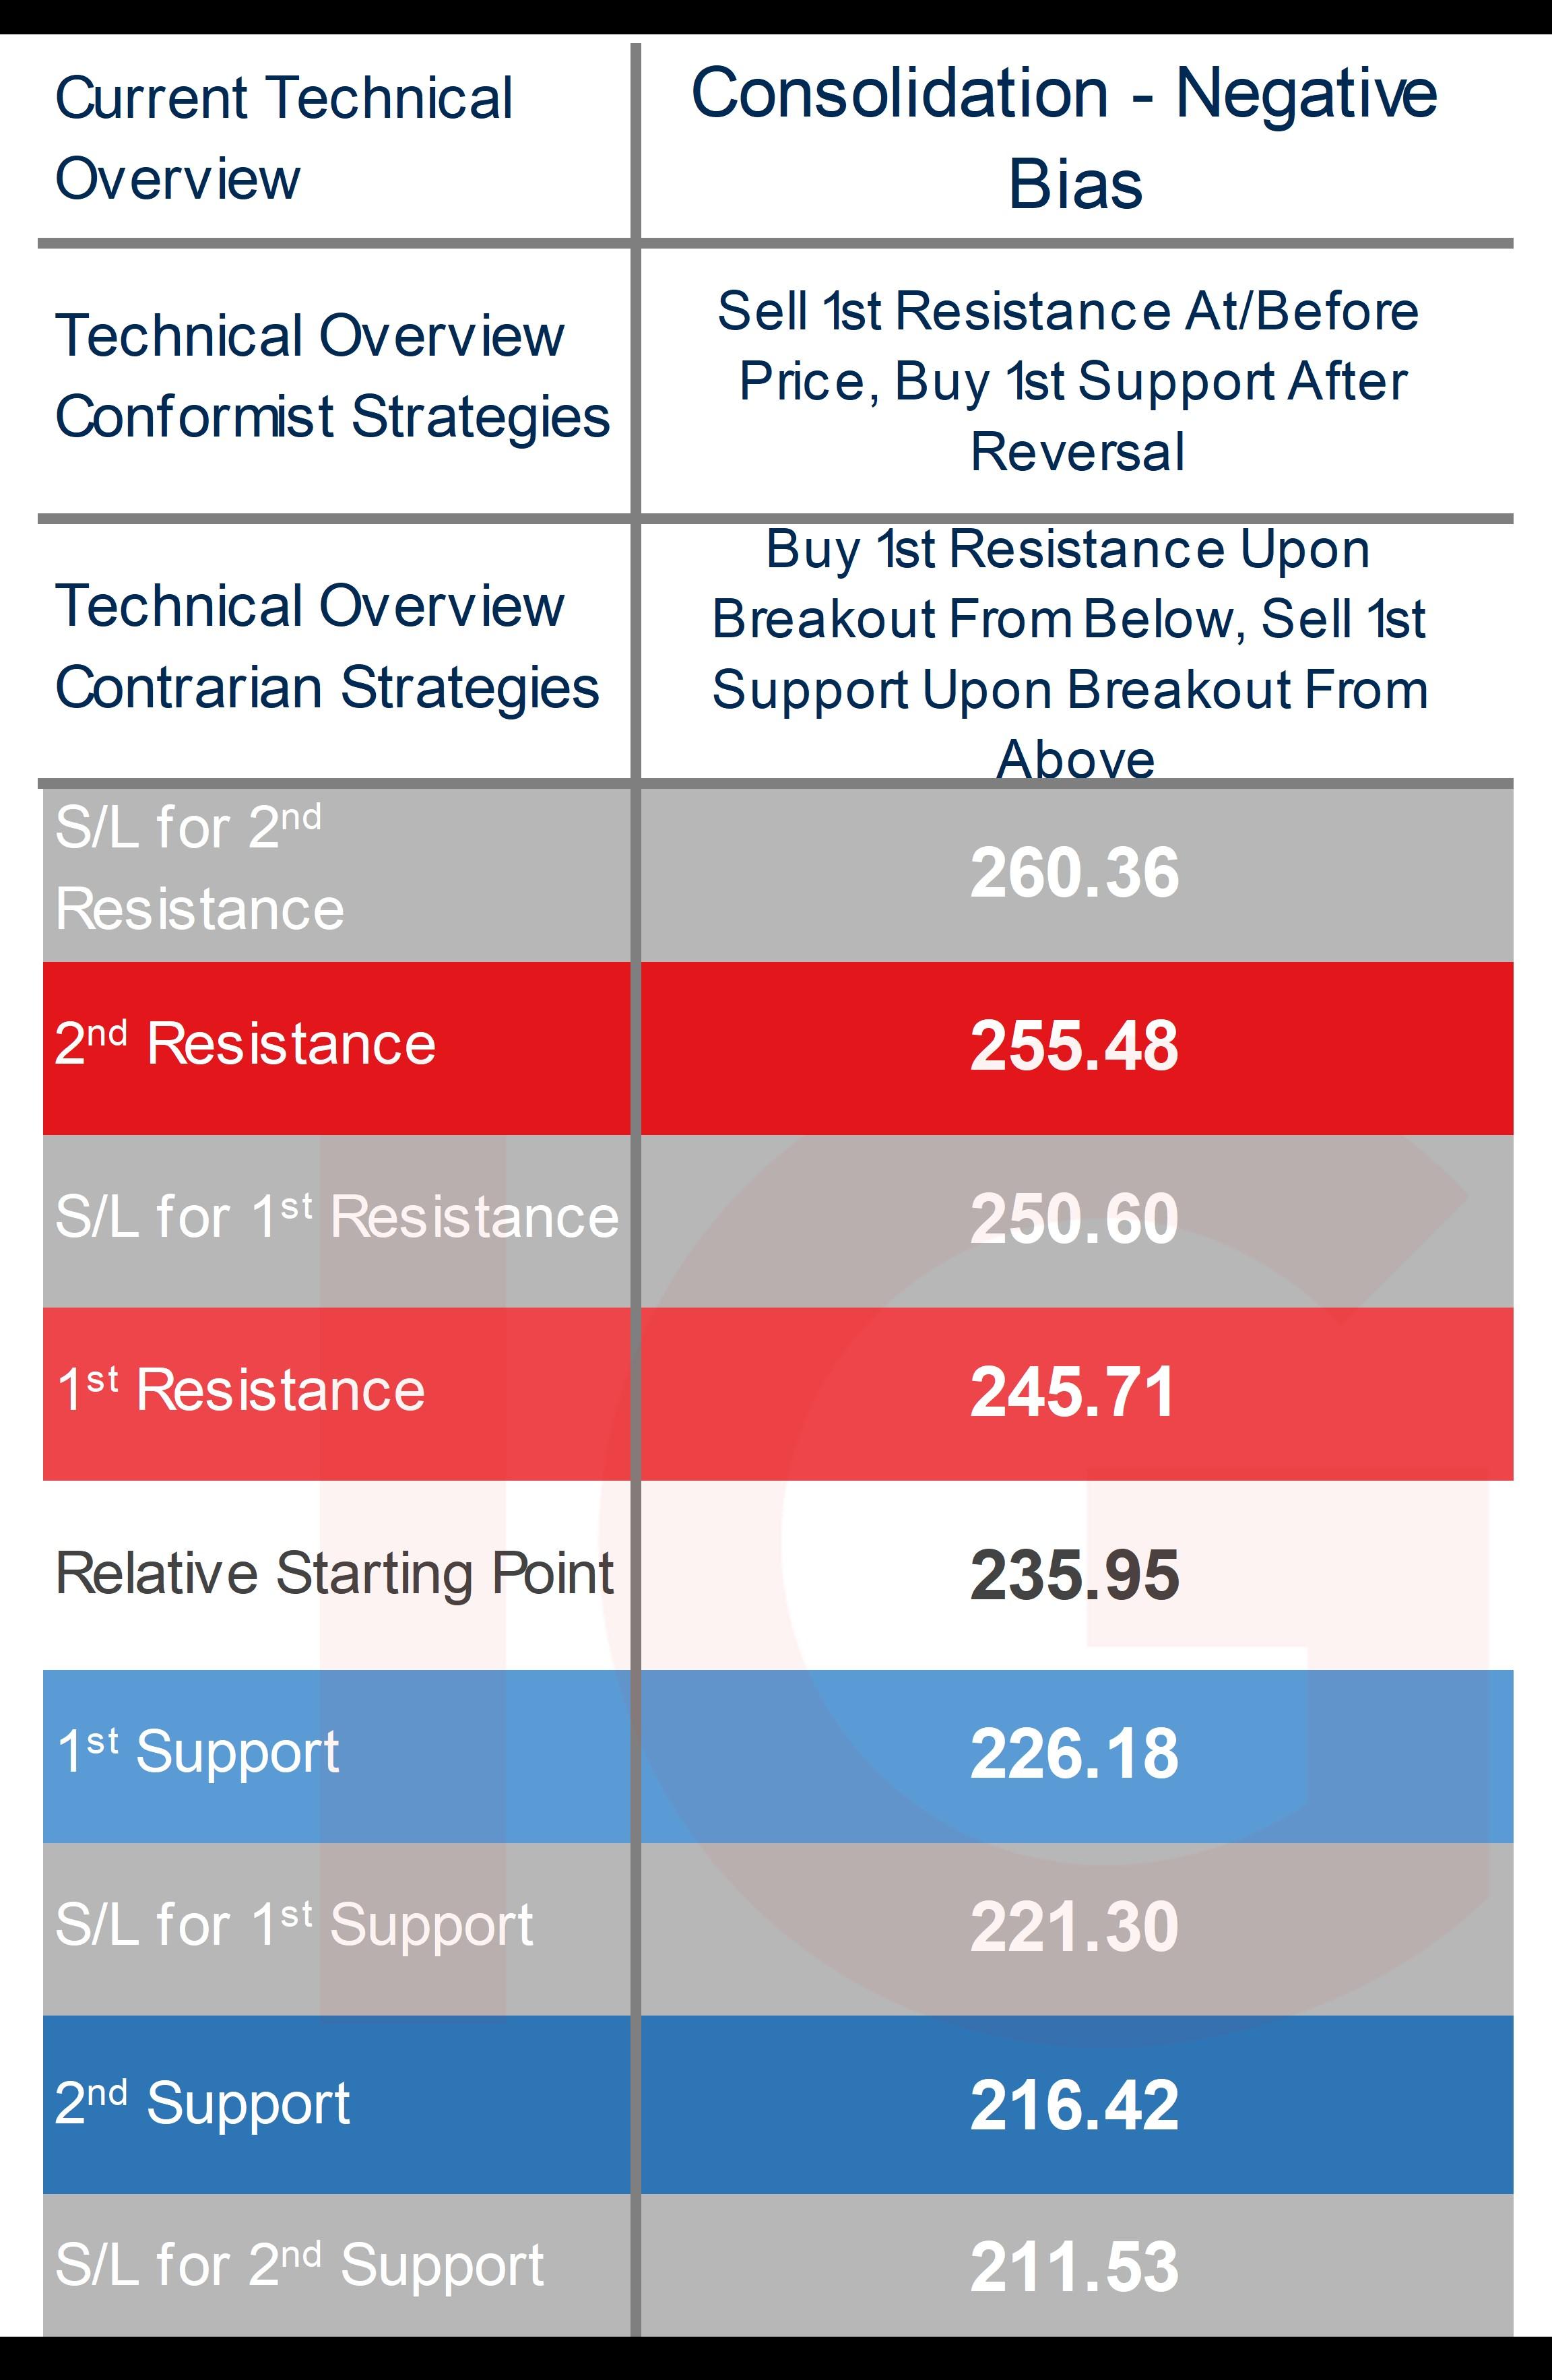
Trading Boeing’s Q2 results: technical overview and trading strategies
Technicals hold far less relevance when it comes to fundamental events, and that means levels likelier than not to break even if we’re looking at the mid-term weekly overview as opposed to the short-term daily, the latter having little chance of levels holding on any volatile moves.
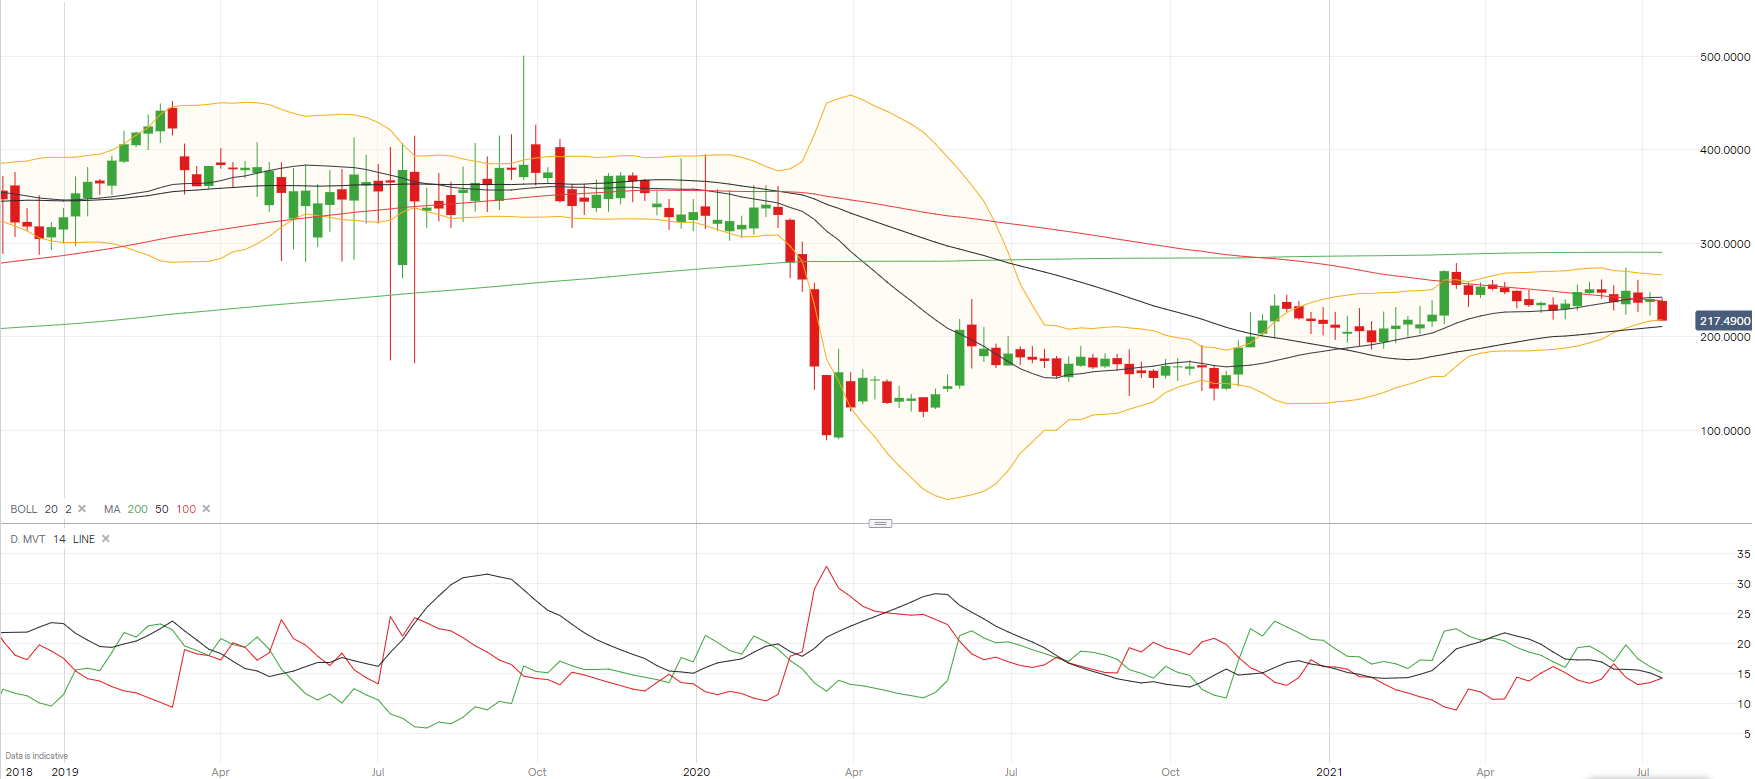
A brief glance at the weekly chart below and its looking weak, prices beneath its key long-term moving averages (MA), which is the 50, 100, and 200-day MA’s, and at the lower end of the Bollinger band, its average directional movement index (ADX) not trending just yet with a reading that’s been dropping. It’s looking far worse on the short-term daily technical overview, most of its key technical indicators in the red and with an ADX that has tilted into trending territory, a classification more befitting of a stalling bear trend. More bearish movement will be needed to shift the overview in the weekly time frame to match that of shorter-term time frames, for now consolidatory but with negative technical bias.
Fading strategies are at greater risk of getting stopped out and puts one of the conformist strategies into the riskier category, and those looking to sell into price gains can consider selling after a reversal due to volatility from the fundamental event, contrarian breakout strategies on any persistence in the move outperforming should it translate into a trend move thereafter.
Boeing weekly chart
IG client sentiment* and short interest for Boeing shares
Retail bias has been a consistent extreme buy and unchanged since the start of last week at a staggeringly high 97%, overall beneficiaries on the recovery from sub-$100 pandemic lows but tested as of late on the pullback in its price from over $273 a month ago to below $220 at the end of last week.
When it comes to short interest (according to shortsqueeze.com), its far less than that of say Tesla, for Boeing at only 1.61% of the float on 9,410,000 shares shorted from a total of 584,090,000 shares floated, dropping from 10 million prior.
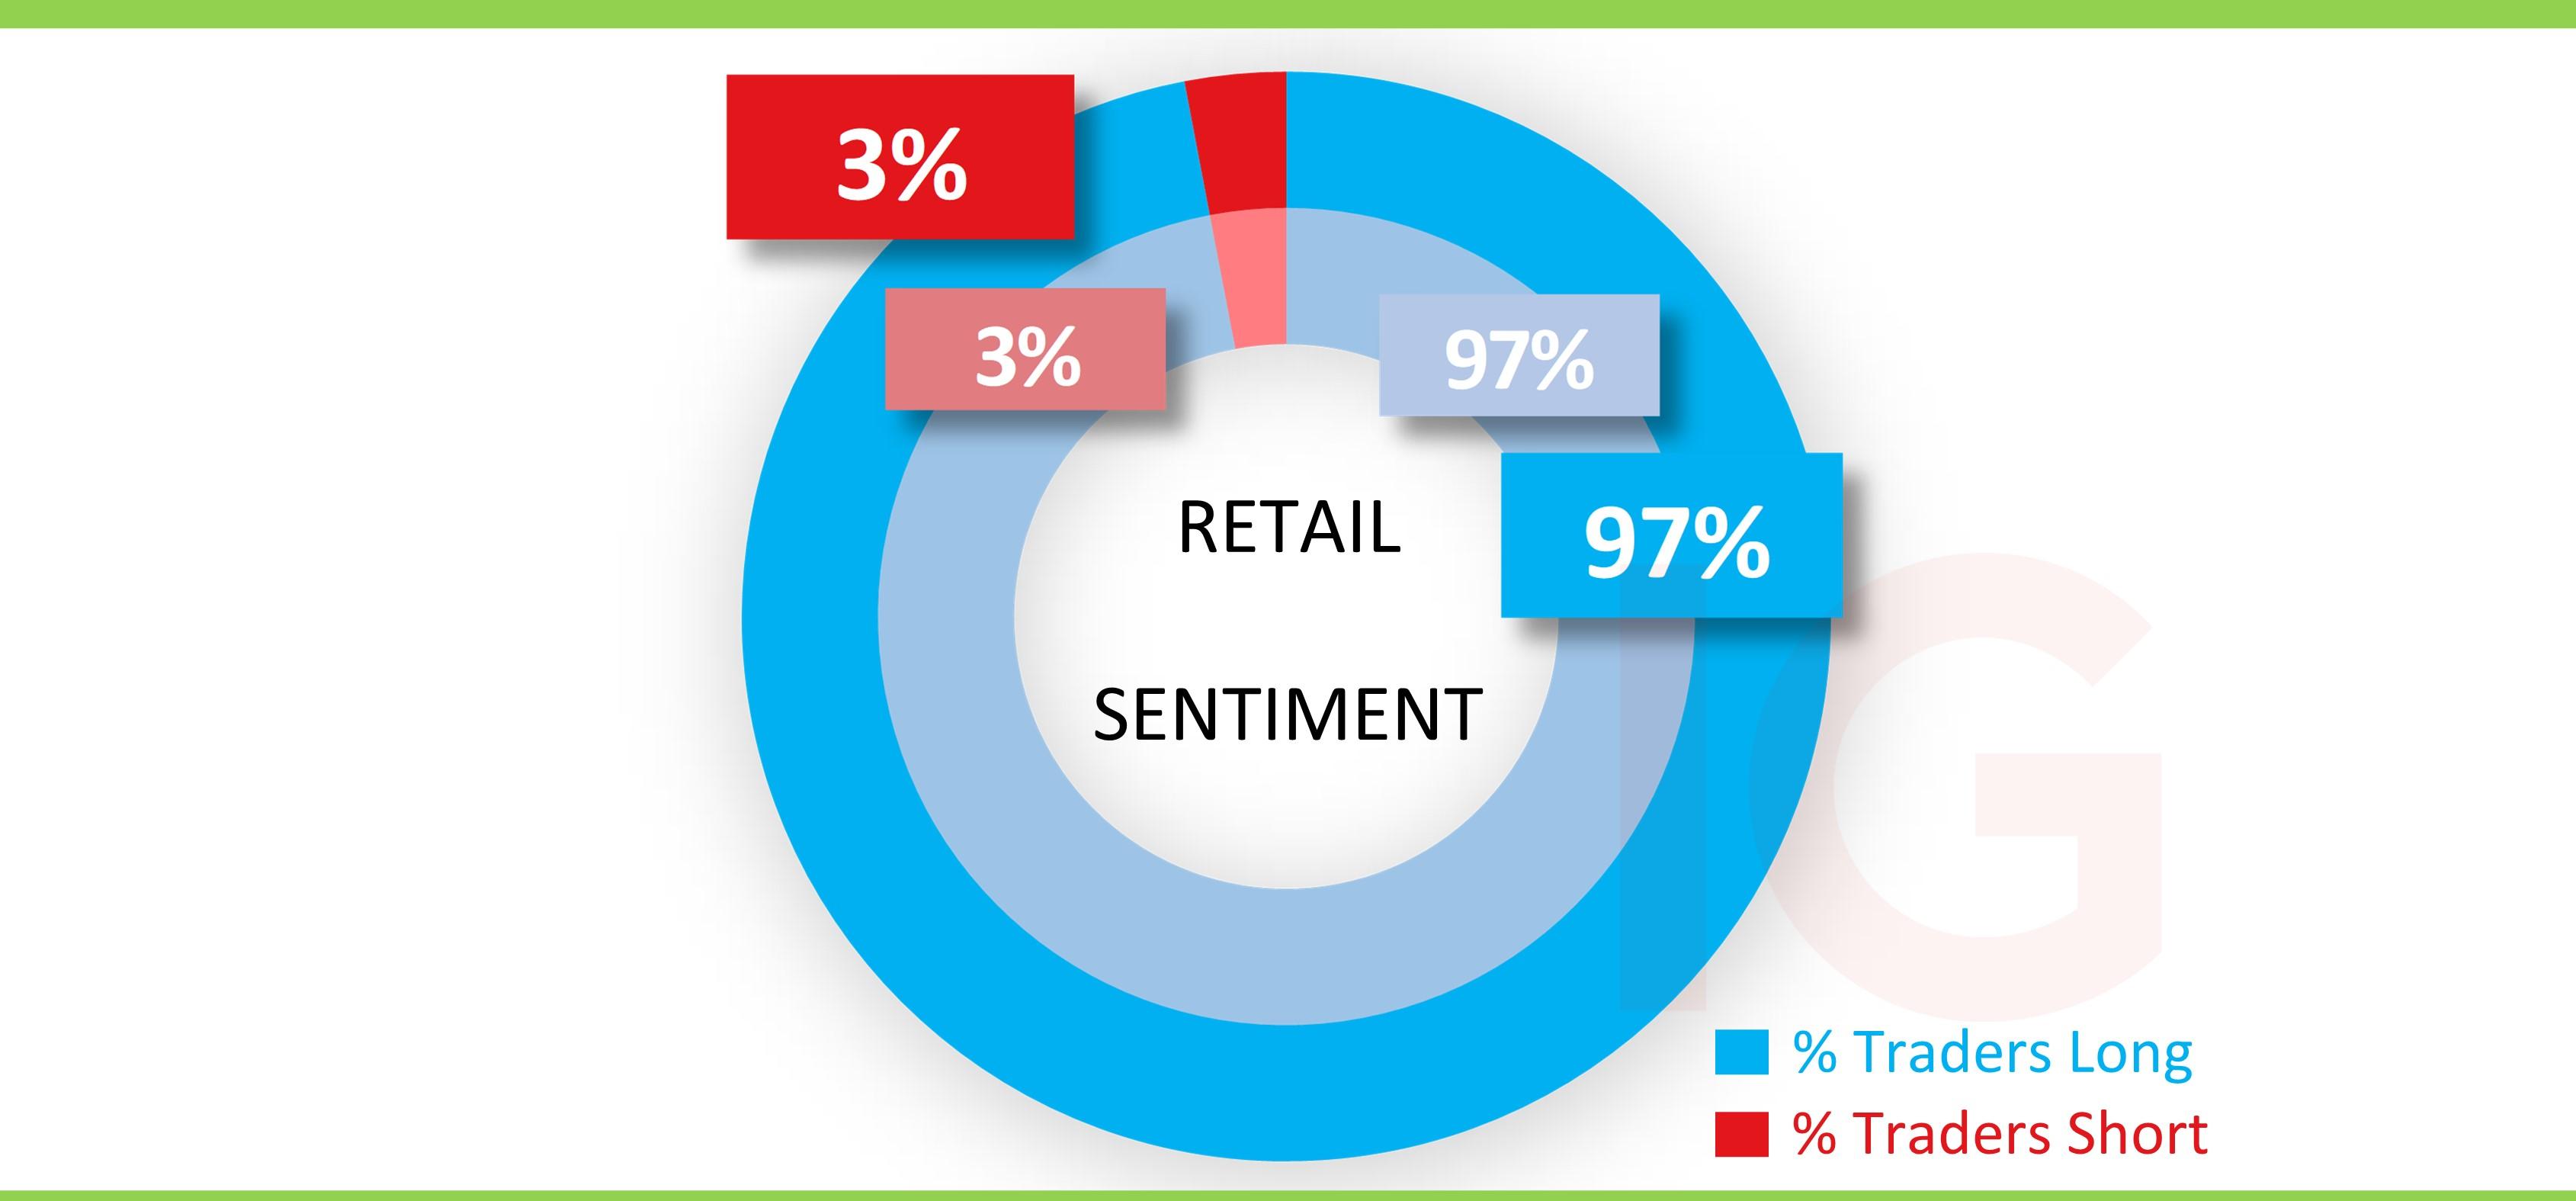
*The percentage of IG client accounts with positions in this market that are currently long or short. Calculated to the nearest 1%, as of this morning, 8am, for the outer circle. Inner circle is from the previous trading day.
IGA, may distribute information/research produced by its respective foreign affiliates within the IG Group of companies pursuant to an arrangement under Regulation 32C of the Financial Advisers Regulations. Where the research is distributed in Singapore to a person who is not an Accredited Investor, Expert Investor or an Institutional Investor, IGA accepts legal responsibility for the contents of the report to such persons only to the extent required by law. Singapore recipients should contact IGA at 6390 5118 for matters arising from, or in connection with the information distributed.
The information/research herein is prepared by IG Asia Pte Ltd (IGA) and its foreign affiliated companies (collectively known as the IG Group) and is intended for general circulation only. It does not take into account the specific investment objectives, financial situation, or particular needs of any particular person. You should take into account your specific investment objectives, financial situation, and particular needs before making a commitment to trade, including seeking advice from an independent financial adviser regarding the suitability of the investment, under a separate engagement, as you deem fit.
No representation or warranty is given as to the accuracy or completeness of this information. Consequently, any person acting on it does so entirely at their own risk. Please see important Research Disclaimer.
Please also note that the information does not contain a record of our trading prices, or an offer of, or solicitation for, a transaction in any financial instrument. Any views and opinions expressed may be changed without an update.

Seize a share opportunity today
Go long or short on thousands of international stocks.
- Increase your market exposure with leverage
- Get spreads from just 0.1% on major global shares
- Trade CFDs straight into order books with direct market access
Live prices on most popular markets
- Forex
- Shares
- Indices
See more forex live prices
See more shares live prices
Prices above are subject to our website terms and agreements. Prices are indicative only. All shares prices are delayed by at least 15 mins.
See more indices live prices
Prices above are subject to our website terms and agreements. Prices are indicative only. All shares prices are delayed by at least 20 mins.
