Alibaba’s fundamentals overshadowed by government actions ahead of earnings
Alibaba continues to enjoy strong revenue and customer growth, but the decline in its stock price reflects a bleaker outlook thanks to the actions of the Chinese government.


When is Alibaba’s earnings date?
Alibaba reports earnings on 3 August, covering its fiscal first quarter (Q1).
Alibaba earnings – what to expect
Alibaba is expected to report revenue of $32 billion, with earnings per share of $2.24.
Alibaba continues to enjoy excellent growth, achieving one billion customers in the 2021 financial year (FY2021), with the vast majority of these based in China. Profit margins and revenues have risen at a steady pace in every year since 2013, at 10% and 23% respectively.
However, for Chinese tech shares such as Alibaba, the main concern is no longer business performance, but the attitude of the Chinese government instead. The cancellation of the Ant Financial initial public offering (IPO) and the current clampdown on tutoring stocks points towards a much more restrictive approach to the private sector.
As many could have predicted, the culture clash between free market capitalism and the controlling instincts of the Chinese Communist Party has begun anew, with the Party determined to rein in the perceived excesses of the free market.
This is a situation unfamiliar to many investors, unused to the impact of government interference on most companies except in relatively isolated circumstances, and accounts for the underperformance of Chinese shares, with Alibaba no exception.
Find out more on how to buy, sell, and short Alibaba shares
Alibaba broker ratings
A total of 17 analysts currently rate Alibaba as a ‘strong buy’, with 30 more at ‘buy’. Three analysts have a ‘hold’ rating, and only one ‘sell’.
Alibaba stock – technical analysis
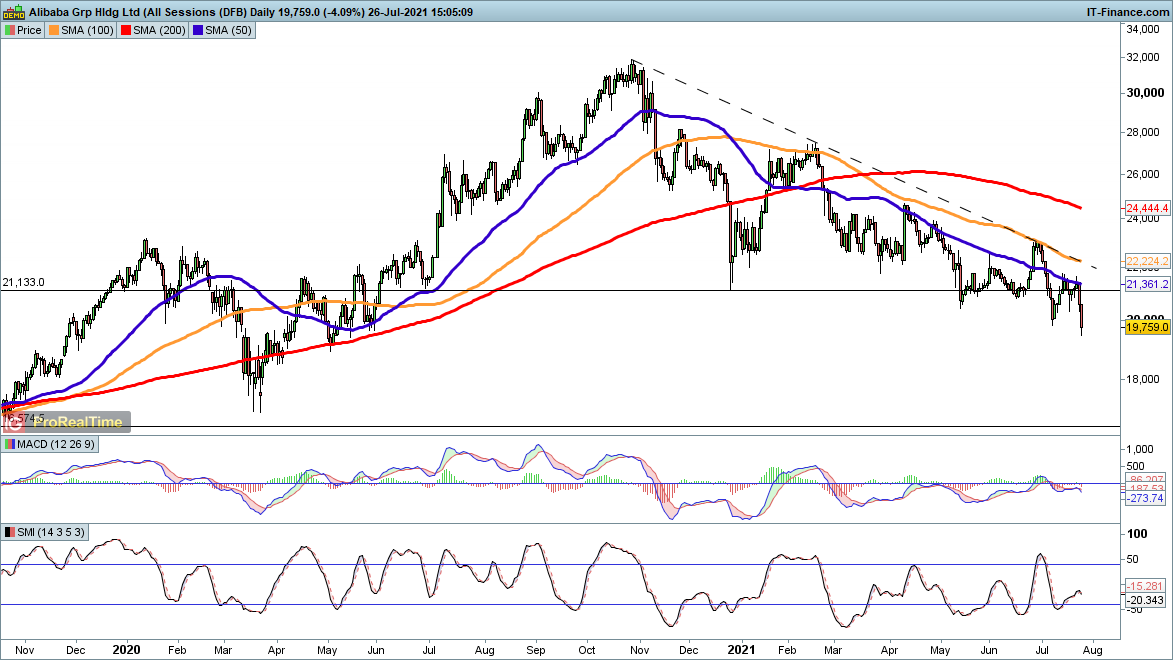
The direction in Alibaba stock is clear for the time being. Rallies have been regularly sold, with the latest bounce in late June running into the 100-day simple moving average (SMA), currently 22,225.
With the macro outlook so unfavourable the stock continues to reflect investor caution, so it looks like further declines are on the cards as the price targets 18,000 and lower.
A solid business, but outlook continues to darken
Alibaba has plenty to commend it from a fundamental perspective, but with Beijing adopting an activist position the stock continues to decline.
Investors might argue that this means Alibaba is becoming a bargain, but traders will want to see a turnaround in the price, which is unlikely to happen unless the Chinese government reduces its interventions.
IGA, may distribute information/research produced by its respective foreign affiliates within the IG Group of companies pursuant to an arrangement under Regulation 32C of the Financial Advisers Regulations. Where the research is distributed in Singapore to a person who is not an Accredited Investor, Expert Investor or an Institutional Investor, IGA accepts legal responsibility for the contents of the report to such persons only to the extent required by law. Singapore recipients should contact IGA at 6390 5118 for matters arising from, or in connection with the information distributed.
The information/research herein is prepared by IG Asia Pte Ltd (IGA) and its foreign affiliated companies (collectively known as the IG Group) and is intended for general circulation only. It does not take into account the specific investment objectives, financial situation, or particular needs of any particular person. You should take into account your specific investment objectives, financial situation, and particular needs before making a commitment to trade, including seeking advice from an independent financial adviser regarding the suitability of the investment, under a separate engagement, as you deem fit.
No representation or warranty is given as to the accuracy or completeness of this information. Consequently, any person acting on it does so entirely at their own risk. Please see important Research Disclaimer.
Please also note that the information does not contain a record of our trading prices, or an offer of, or solicitation for, a transaction in any financial instrument. Any views and opinions expressed may be changed without an update.

Seize a share opportunity today
Go long or short on thousands of international stocks.
- Increase your market exposure with leverage
- Get spreads from just 0.1% on major global shares
- Trade CFDs straight into order books with direct market access
Live prices on most popular markets
- Forex
- Shares
- Indices
See more forex live prices
See more shares live prices
Prices above are subject to our website terms and agreements. Prices are indicative only. All shares prices are delayed by at least 15 mins.
See more indices live prices
Prices above are subject to our website terms and agreements. Prices are indicative only. All shares prices are delayed by at least 20 mins.
