What impact may Q1 results have on the American Airlines share price?
American Airlines will report its Q1 2024 earnings on April 25, forecasting a 3% revenue increase to $12.602 billion and an EPS drop to -$0.29, showcasing resilience in a fluctuating economy.


When does American Airlines report earnings?
The Nasdaq listed air carrier operator for passengers and cargo, is scheduled to report its first quarter (Q1) 2024 earnings on Thursday, 25th of April 2024.
What to expect from American Airlines Q1 2024 results?
The aviation industry has witnessed a myriad of challenges and transformations over the past few years, particularly with the advent and the eventual tapering off of the global pandemic. As we set our sights on the forthcoming financial milestones in 2024, American Airlines emerges as a focal point for investors and market analysts alike, keen on deciphering the trajectory of its financial performance amidst the evolving economic landscape.
Robust earnings outlook: a closer look at the drivers
American Airlines is anticipated to hit the runway with earnings for the Q1 of 2024. With projections indicating a revenue surge to $12.602 billion, marking an 3% YoY growth, but EPS expected to slip from $0.05 in Q4 to -$0.29 in Q1 several factors are at play.
On the one hand there is robust demand for air travel, which has nearly reached the pre-pandemic zeniths of 2019. This resurgence is a testament to a confluence of factors including leisure and business travel revival, particularly in high-yield regions like domestic US and Latin America. Also, the stabilization of jet fuel prices offers a sigh of relief in terms of operational costs, positioning the airline for a more cost-efficient glide through 2024.
Tailwinds and turbulence: economic influences on the flight path
On the other hand, the spectre of economic slowdowns and inflationary pressures looms, threatening to steer consumer spending on air travel slightly off course. Nevertheless, the airline’s strategic positioning for peak travel seasons, such as spring break and the onset of summer, provides a window of opportunity to capitalize on increased travel demand, thereby bolstering revenue through heightened fares and ancillary fees.
The forecast: clear skies ahead?
As American Airlines ascends into 2024, the forecast looks promising with the airline poised for growth in revenue and earnings during Q1. This optimism is not without caution, as external economic forces and operational efficiencies remain pivotal to sustaining this upward momentum.
What are the key takeaways?
- Revenue of $12.602 billion : +3% year-on-year (YoY)
- Q1 2024 earnings per share (EPS) of -$0.29 expected
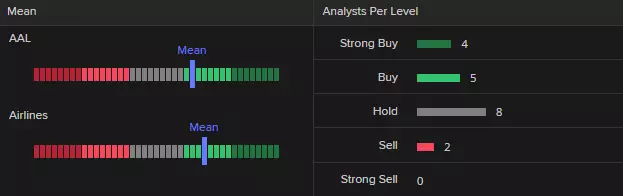
- A consensus of analyst ratings have between a ‘buy’ and a ‘hold’ rating on the stock
Trading American Airlines
Refinitiv data shows a consensus analyst rating of between a ‘buy’ and a ‘hold’ for American Airlines – 4 strong buy, 5 buy, 8 hold and 2 sell (as of 17 April 2024).
Analyst rating on American Airlines
American Airlines' technical view
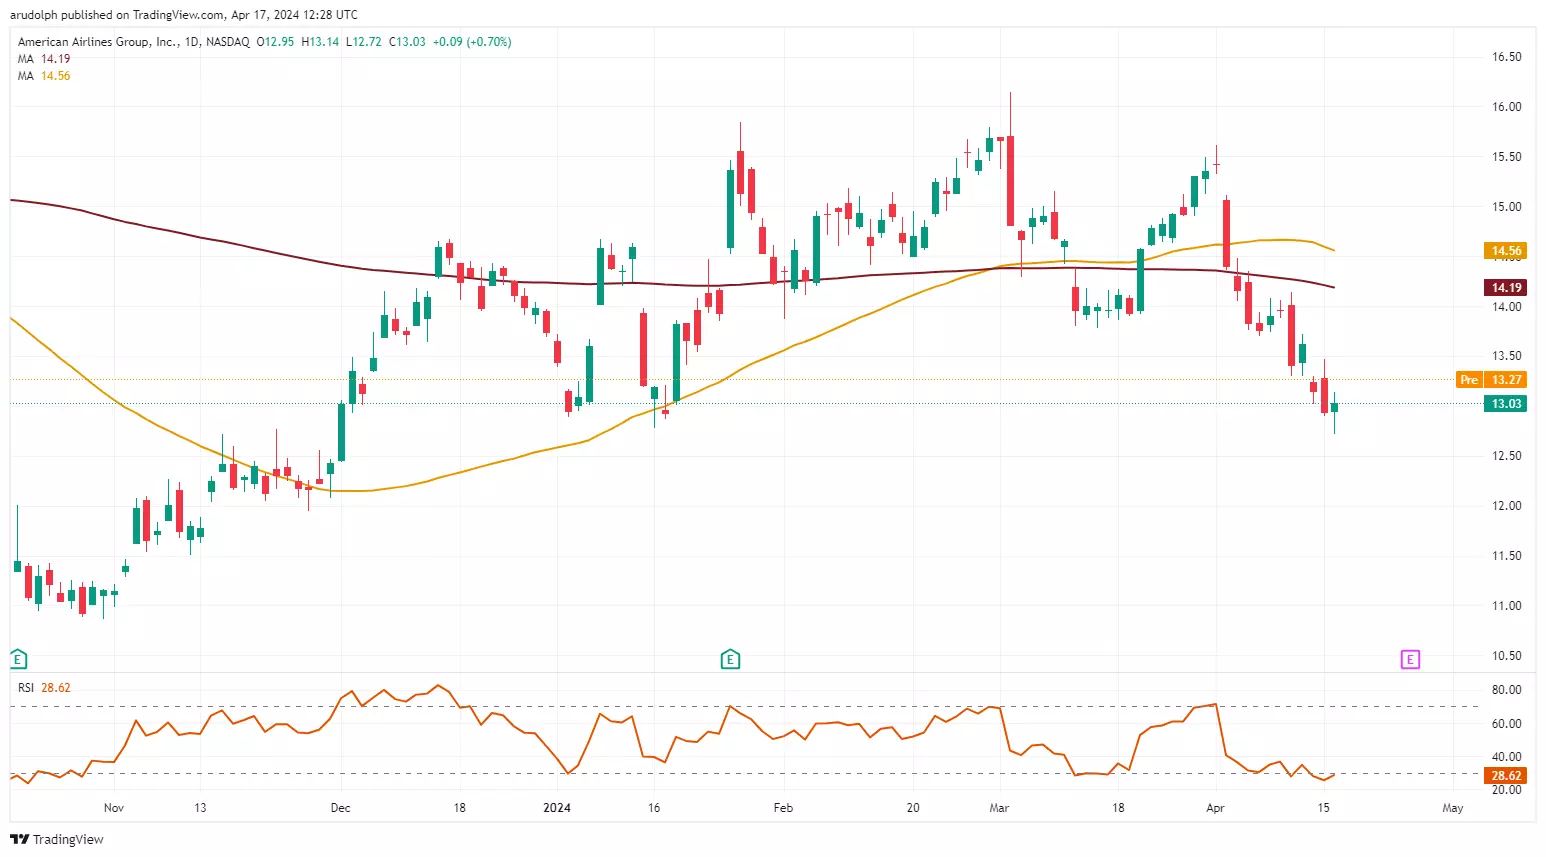
The American Airlines share price, down around 3% year-to-date, and weighing on its $12.78 January low, remains under pressure ahead of next week’s results. A fall through and daily chart close below the $12.78 January low would engage the $11.95 late-November low, below which lies the three-year October 2023 low at $10.86.
Were the January low at $12.78 to hold, though, and a bullish reversal take the American Airlines share price above its 10 April high at $14.15, the January-to-April highs at $15.61 to $16.15 would be back on the map.
American Airlines daily chart
IGA, may distribute information/research produced by its respective foreign affiliates within the IG Group of companies pursuant to an arrangement under Regulation 32C of the Financial Advisers Regulations. Where the research is distributed in Singapore to a person who is not an Accredited Investor, Expert Investor or an Institutional Investor, IGA accepts legal responsibility for the contents of the report to such persons only to the extent required by law. Singapore recipients should contact IGA at 6390 5118 for matters arising from, or in connection with the information distributed.
The information/research herein is prepared by IG Asia Pte Ltd (IGA) and its foreign affiliated companies (collectively known as the IG Group) and is intended for general circulation only. It does not take into account the specific investment objectives, financial situation, or particular needs of any particular person. You should take into account your specific investment objectives, financial situation, and particular needs before making a commitment to trade, including seeking advice from an independent financial adviser regarding the suitability of the investment, under a separate engagement, as you deem fit.
No representation or warranty is given as to the accuracy or completeness of this information. Consequently, any person acting on it does so entirely at their own risk. Please see important Research Disclaimer.
Please also note that the information does not contain a record of our trading prices, or an offer of, or solicitation for, a transaction in any financial instrument. Any views and opinions expressed may be changed without an update.

Start trading forex today
Trade the largest and most volatile financial market in the world.
- Spreads start at just 0.6 points on EUR/USD
- Analyse market movements with our essential selection of charts
- Speculate from a range of platforms, including on mobile
Live prices on most popular markets
- Forex
- Shares
- Indices
See more forex live prices
See more shares live prices
Prices above are subject to our website terms and agreements. Prices are indicative only. All shares prices are delayed by at least 15 mins.
See more indices live prices
Prices above are subject to our website terms and agreements. Prices are indicative only. All shares prices are delayed by at least 20 mins.
