S&P 500 outlook for 2024
Fundamental and technical outlook on the S&P 500

Taking stock of 2023
Despite warnings of a recession in the US by the International Monetary Fund (IMF), the US Federal Reserve (Fed) and several major investment banks at the beginning of the year, the US economy and the country’s stock market(s) have done tremendously well.
US inflation halved from 6.4% in January to 3.2% in October, even if core inflation proved to be stickier at 4.0%, while seasonally-adjusted unemployment rose slightly from 3.4% to 3.9% and gross domestic product (GDP) came in at a respectable 2.1% year-on-year.
At the same time the S&P 500 has so far risen by close to 25% year-to-date, a positive performance which none of the major investment banks had forecast.
2024 outlook
The S&P 500 is expected to continue its recent advance and might still do well at the beginning of the first quarter (Q1) of next year but then a possible slow down in the US economy may lead to a significant reversal in the trend.
Since earlier in the year the tables have turned with the Fed no longer expecting a recession due to the robustness of the US economy.
The danger, as is often the case when data keeps on coming in better-than-expected and earnings - such as those seen in the Q3 - are pointing to a better outlook for US companies than many had feared, is that investors become complacent.
A potential sign of this complacency is the Chicago Board Option Exchange’s (CBOE) Volatility Index (VIX) which dipped to its lowest level since January 2020 amid seven straight weeks of gains in US equity indices. In that time the Dow Jones Industrial Average and S&P 500 rallied by around 15%, the Nasdaq 100 by just under and the Russell 2000 (small cap index) by over 20%. The VIX can remain at extremely low levels for several weeks, though, before equity markets top out.
The remarkable recovery in risk appetite, driven by a falling dollar, declining US Treasury yields to between five and seven month lows and Fed rate cut expectations being brought forward to March of next year, is likely to have legs, at least into the first few weeks of 2024. This scenario remains the most probable even if a short-term sell-off at the beginning of next year were to be seen.
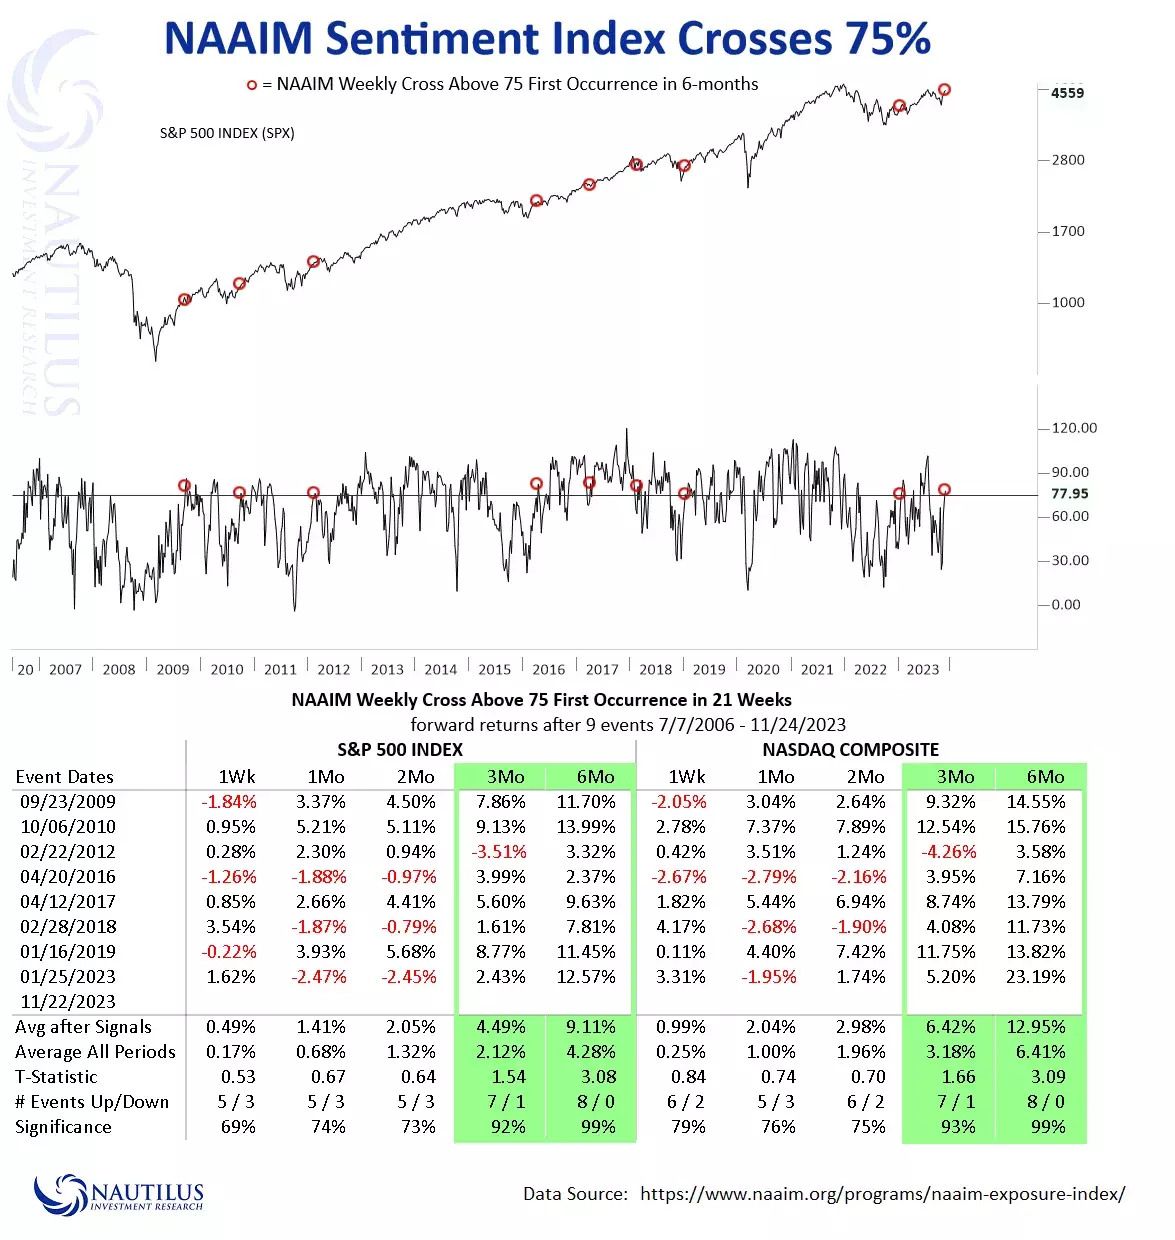
Bullish factors are that over 55% of S&P 500 stocks now trade above their 200-day simple moving averages (SMA), the National Association of Active Investment Managers (NAAIM) Sentiment Index has been trading above 75 this past month and seasonality usually leads to end-of year gains.
Stocks trading above their 200-day SMA are considered to be long-term bullish. Now that over half the S&P 500’s stocks are trading above their 200-day SMAs the bull market looks to be more solid than it was in the first half of this year.
When the NAAIM Sentiment Index crosses 75 for the first time in 21 weeks, the three- and six-month forward returns have all been bullish, some in double digits, between mid-2006 and now. The only exception has been the three-month period following such as signal in February 2012 but even then a positive 3.32% performance was seen after six-months.
NAAIM Sentiment Index Chart and data table
Then there is the ‘Santa Claus Rally’: according to StockTradersAlmanac.com, since 1950, the S&P 500 is up 79.45% of the time from the Tuesday before Thanksgiving to the 2nd trading day of the year with an average gain of 2.57%.
There is an important caveat to the “Santa Claus Rally” though, coined by its 1972 inventor Yale Hirsch’s phrase: “If Santa Claus should fail to call, bears may come to Broad and Wall.”
Risks for 2024
The same risks the Fed and others feared at the beginning of the year are still bubbling under the surface.
These are:
- rapidly rising short-end interest rates
- a spike in inflation
- inversions of the yield curve
- and oil price shocks
Even if these occurrences haven’t as yet led to a recession in the US in 2023, they may well do so in 2024.
A Deutsche Bank team led by Jim Reid, head of global economics and thematic research, in November highlighted these four key macroeconomic triggers that have caused recessions in the past and analysed 34 US recessions dating back to 1854, looking for patterns in economic history.
For each trigger, the Deutsche Bank team calculated a historical “hit ratio”—or the percentage of times when these events occurred that led to a recession.
Even though they found that no single macroeconomic trigger can accurately predict a recession, all four together – as is the case at present - greatly increase the odds of a US recession rearing its head.
The rapid rise in interest rates since the Q1 of 2022 from 0% to 0.25% to the current Fed funds at 5.25% to 5.50% - by more than 5% - is bound to weigh on economic growth by raising the cost of borrowing for businesses and consumers but may take time to work its way through the economy.
According to Deutsche Bank’s study, since 1854, when US short-term interest rates have risen by 2.5 percentage points over a 24-month period, there has been a recession within three years around 69% of the time.
Also since 1854, a three percentage point rise in inflation over a 24-month period has caused a recession within three years 77% of the time.
The fact that US inflation soared to a four-decade high to 9.1% in June of 2022, even if it has since retreated to a much milder 3.2%, points to a probable recession since historically the US economy hasn’t managed inflationary spikes very well.
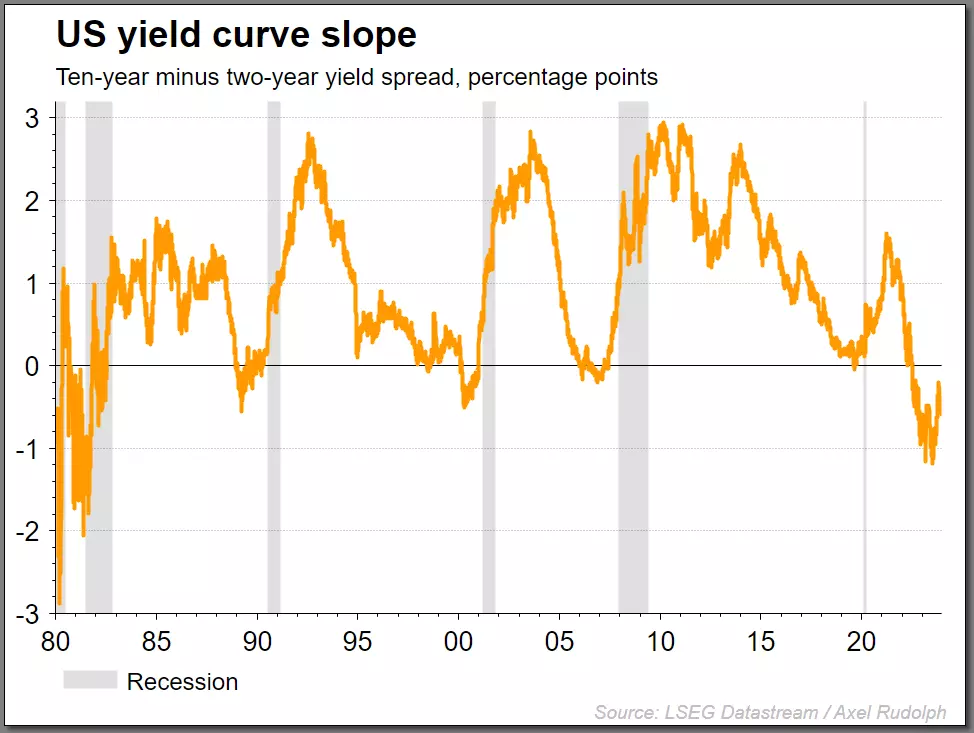
An inverted yield curve - when short-term bonds end up yielding more than long-term bonds - has caused a US recession in 74%, but since the 1953 recession, in nearly 80% of cases, the Deutsche Bank study shows.
US Treasuries have been inverted since July 2022 but may normalise in 2024. Historically when the yield curve un-inverts, as investors take more risk when loaning out their money on longer-term time frames and thus want to be compensated for this by a higher yield, a recession tends to follow.
US 10-year minus 2-year yield curve slope and US recessions chart
Last but not least an oil price shock has led to a US recession 45% of the time, according to the Deutsche Bank research team.
West Texas Intermediate (WTI) crude oil prices have risen by nearly 40% from June to September, to close to $95 per barrel, leading many economists to fear inflation could prove to be more sticky than the Fed might have imagined. This fear might be mitigated by the sharp over 20% drop in the oil price from its late-September peak to current levels.
The Deutsche Bank study aside, there is another factor that might need considering and it is that since the 1950s nearly each time the first US rate cut was made after a hiking cycle, a US recession followed in the coming year(s). Since the first Fed fund rate cut is currently expected to be seen in March of next year, a recession might be on the table for the latter half of 2024.
S&P 500 technical analysis forecast
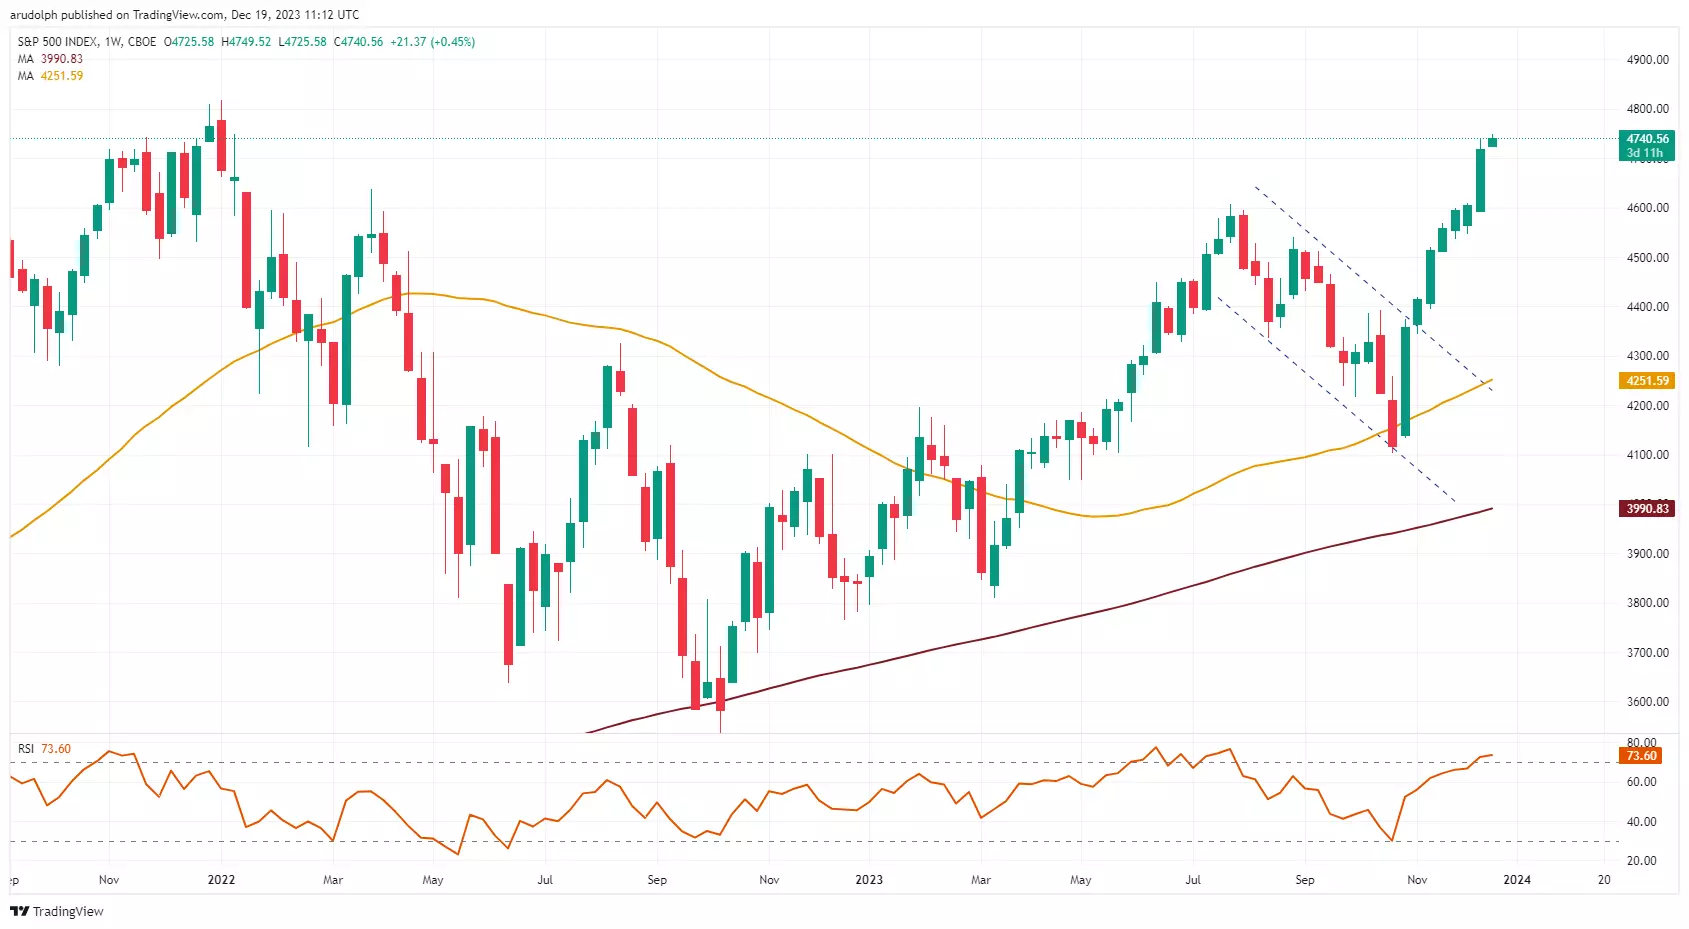
Since the strong November gains occurred after the S&P 500 broke out of a ‘bull flag’ technical chart pattern at 4,356, it is to be expected that during the first half of 2024 the index is not only likely to exceed its January 2022 all-time record high at 4,818.62 but may also reach the psychological 5,000 zone before a possible significant correction or bear market unfolds.
The reason is that the near 800-point ‘flagpole’ in that ‘bull flag’ pattern - the March-to-July advance – is projected from the pattern breakout point at 4,356, giving technical analysts a potential upside target of 4,536 plus 800 = 5,336.
S&P 500 Weekly Candlestick Chart
IGA, may distribute information/research produced by its respective foreign affiliates within the IG Group of companies pursuant to an arrangement under Regulation 32C of the Financial Advisers Regulations. Where the research is distributed in Singapore to a person who is not an Accredited Investor, Expert Investor or an Institutional Investor, IGA accepts legal responsibility for the contents of the report to such persons only to the extent required by law. Singapore recipients should contact IGA at 6390 5118 for matters arising from, or in connection with the information distributed.
The information/research herein is prepared by IG Asia Pte Ltd (IGA) and its foreign affiliated companies (collectively known as the IG Group) and is intended for general circulation only. It does not take into account the specific investment objectives, financial situation, or particular needs of any particular person. You should take into account your specific investment objectives, financial situation, and particular needs before making a commitment to trade, including seeking advice from an independent financial adviser regarding the suitability of the investment, under a separate engagement, as you deem fit.
No representation or warranty is given as to the accuracy or completeness of this information. Consequently, any person acting on it does so entirely at their own risk. Please see important Research Disclaimer.
Please also note that the information does not contain a record of our trading prices, or an offer of, or solicitation for, a transaction in any financial instrument. Any views and opinions expressed may be changed without an update.

Take a position on indices
Deal on the world’s major stock indices today.
- Trade the lowest Wall Street spreads on the market
- 1-point spread on the FTSE 100 and Germany 40
- The only provider to offer 24-hour pricing
Live prices on most popular markets
- Forex
- Shares
- Indices
See more forex live prices
See more shares live prices
Prices above are subject to our website terms and agreements. Prices are indicative only. All shares prices are delayed by at least 15 mins.
See more indices live prices
Prices above are subject to our website terms and agreements. Prices are indicative only. All shares prices are delayed by at least 20 mins.
