GBP/USD, EUR/GBP and EUR/USD amid BoE rate decision
Outlook on GBP/USD, EUR/GBP and GBP/USD around the BoE’s rate decision.


GBP/USD flirts with May low ahead of BoE rate decision
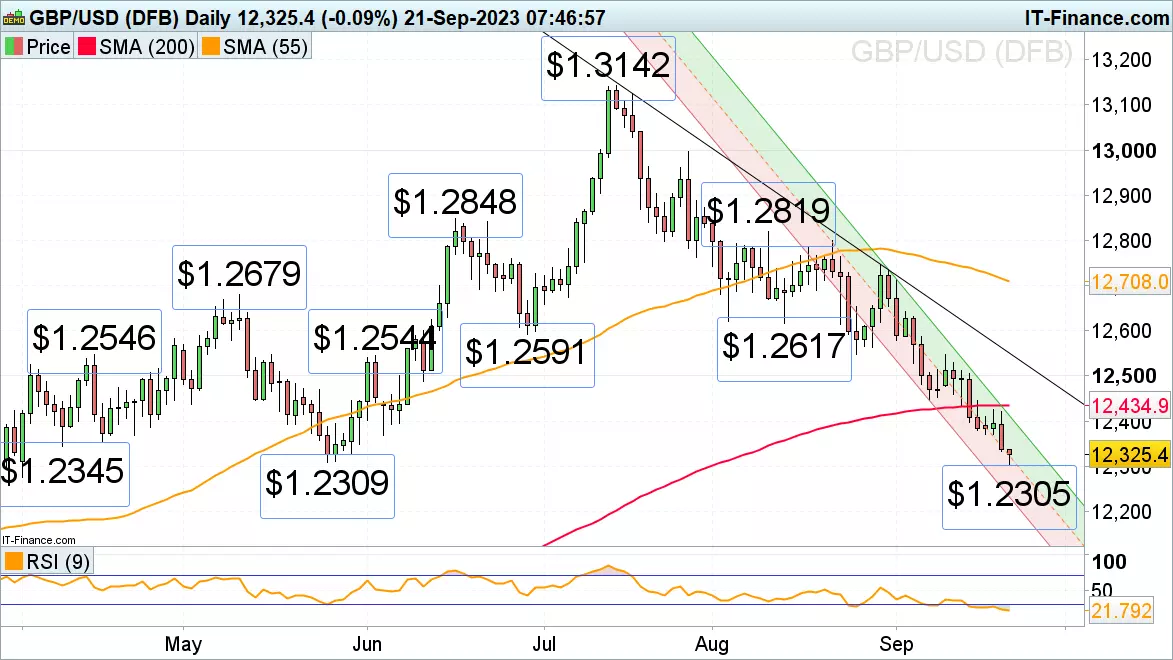
GBP/USD slid all the way to its May low ahead of today’s Bank of England (BoE) monetary policy decision where a fifteenth consecutive rate hike to 5.50% was expected before UK inflation for August came in lower-than-expected at 6.70% (6.20% for core inflation) and questioned this view.
A fall through today’s intraday low at $1.2305 could lead to the mid-February high at $1.2270 being revisited, together with the late January low at $1.2263.
Minor resistance is seen at the 10 April low at $1.2345 and Monday’s $1.2371 low ahead of the 200-day simple moving average (SMA) at $1.2435. While remaining below it, the bearish trend stays firmly entrenched.
EUR/GBP traders await BoE rate announcement
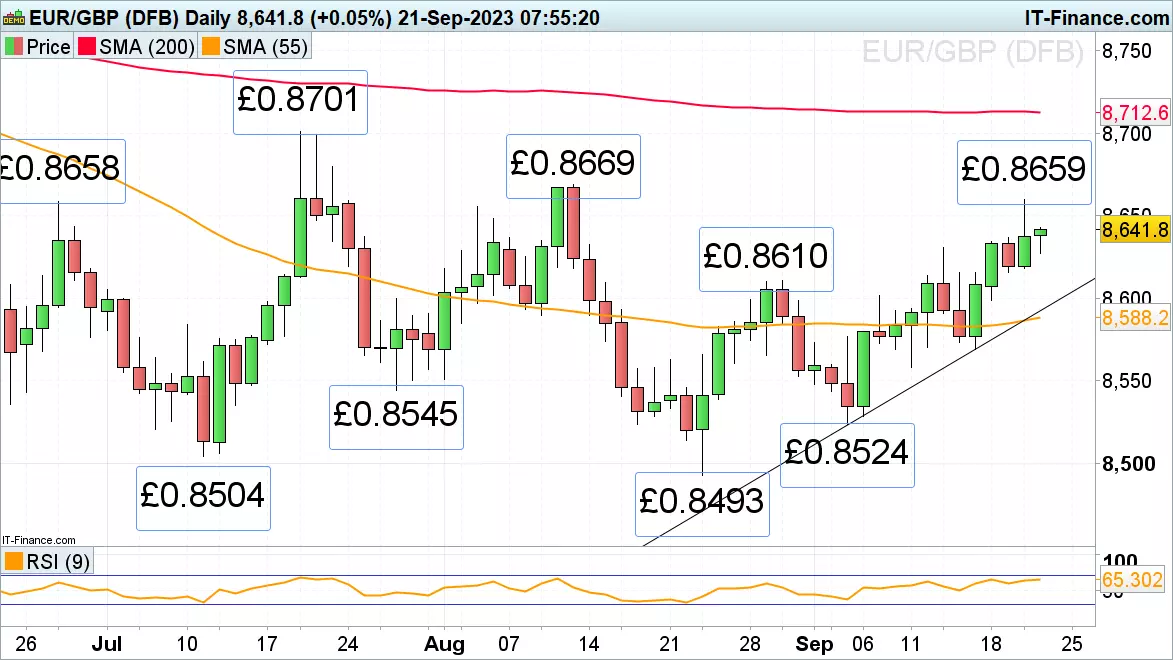
EUR/GBP is heading towards the higher boundary of its June-to-September sideways trading range, having yesterday been capped by its £0.8658 late June high ahead of today’s UK central bank rate decision.
A rise above that high and the next higher £0.8669 August peak would put the July high at £0.8701 on the cards, ahead of the 200-day SMA at £0.8712.
Minor support below last week’s £0.8630 high can be spotted around the £0.8610 late August high.
EUR/USD trades in 3 ½ month lows post ECB rate hike
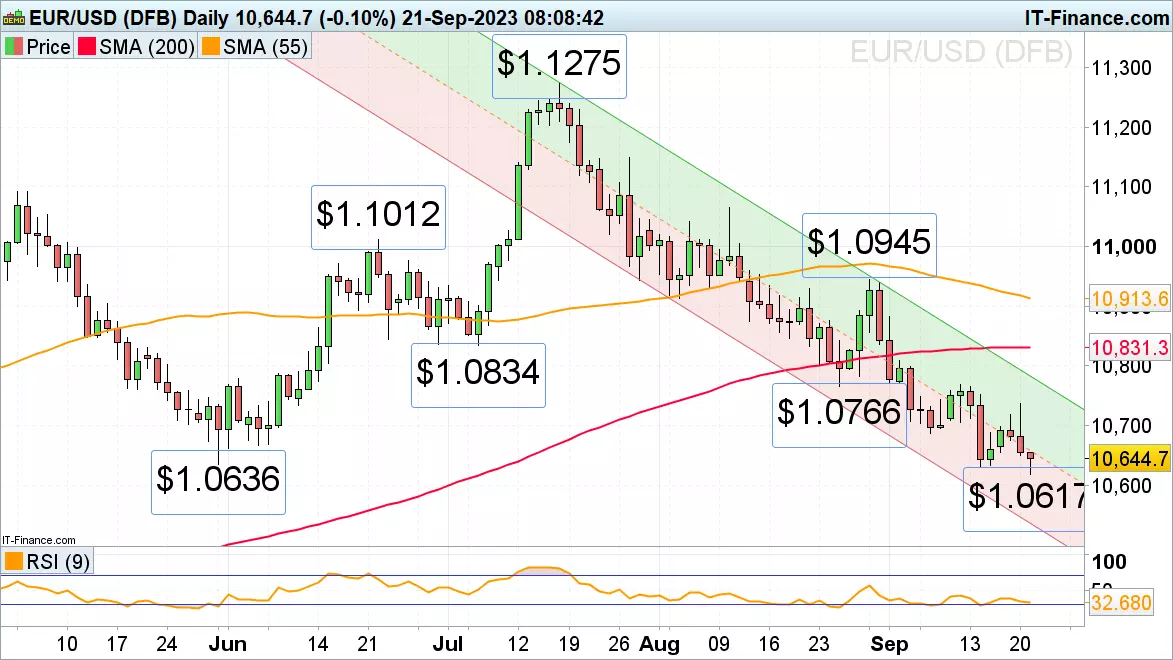
Earlier this morning EUR/USD briefly dropped below its $1.0636 May low to $1.0617 as multi-year high US yields lead to US dollar inflows.
A slide through and daily chart close below today’s intraday low at $1.0617 could provoke a tumble towards the January and March lows at $1.0516 to $1.0484.
As long as the currency pair remains below its last reaction high at $1.0736, seen on Wednesday, the July-to-September downtrend remains intact.
IGA, may distribute information/research produced by its respective foreign affiliates within the IG Group of companies pursuant to an arrangement under Regulation 32C of the Financial Advisers Regulations. Where the research is distributed in Singapore to a person who is not an Accredited Investor, Expert Investor or an Institutional Investor, IGA accepts legal responsibility for the contents of the report to such persons only to the extent required by law. Singapore recipients should contact IGA at 6390 5118 for matters arising from, or in connection with the information distributed.
The information/research herein is prepared by IG Asia Pte Ltd (IGA) and its foreign affiliated companies (collectively known as the IG Group) and is intended for general circulation only. It does not take into account the specific investment objectives, financial situation, or particular needs of any particular person. You should take into account your specific investment objectives, financial situation, and particular needs before making a commitment to trade, including seeking advice from an independent financial adviser regarding the suitability of the investment, under a separate engagement, as you deem fit.
No representation or warranty is given as to the accuracy or completeness of this information. Consequently, any person acting on it does so entirely at their own risk. Please see important Research Disclaimer.
Please also note that the information does not contain a record of our trading prices, or an offer of, or solicitation for, a transaction in any financial instrument. Any views and opinions expressed may be changed without an update.

Start trading forex today
Trade the largest and most volatile financial market in the world.
- Spreads start at just 0.6 points on EUR/USD
- Analyse market movements with our essential selection of charts
- Speculate from a range of platforms, including on mobile
Live prices on most popular markets
- Forex
- Shares
- Indices
See more forex live prices
See more shares live prices
Prices above are subject to our website terms and agreements. Prices are indicative only. All shares prices are delayed by at least 15 mins.
See more indices live prices
Prices above are subject to our website terms and agreements. Prices are indicative only. All shares prices are delayed by at least 20 mins.
