EUR/USD stalls while GBP/USD and USD/JPY push higher
Outlook on EUR/USD, GBP/USD and USD/JPY amid recovering US yields.


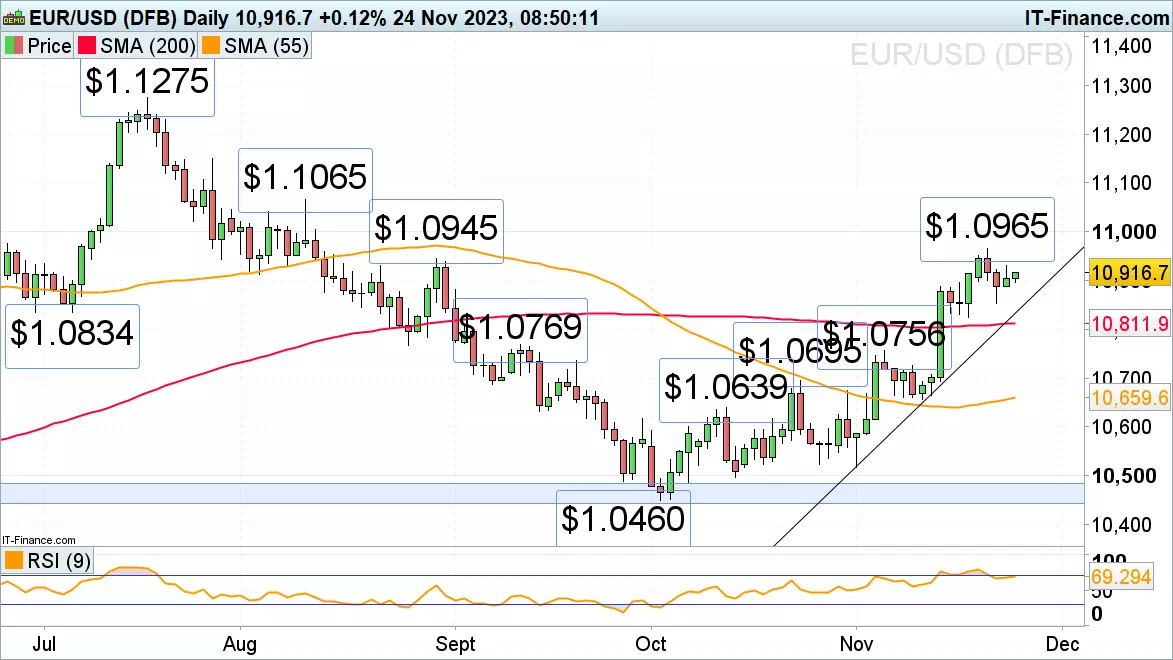
EUR/USD range bound below its four-month high
EUR/USD continues to trade in low volatility and volume as US market participants are mainly absent due to the prolonged Thanksgiving holiday.
The cross still has the $1.0945 late August high in its sights, a rise above which would open the way for its four-month high at $1.0965 to be reached. Further up lie the late June high at $1.1012 and the August peak at $1.1065.
A bullish run will remain the most likely scenario as long as Wednesday’s low at $1.0853 underpins. Minor support below that low comes in around the $1.0834 July low and the 200-day simple moving average (SMA) at $1.0812.
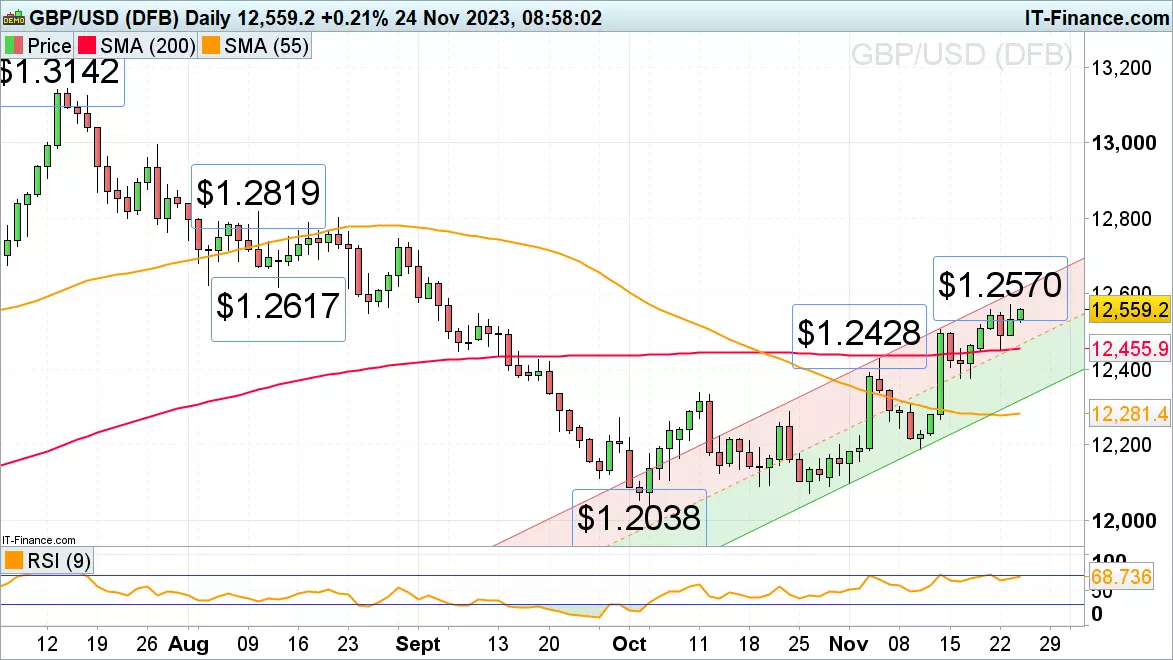
GBP/USD rises on improving UK consumer confidence
GBP/USD is closing in on this week’s high at $1.257 as GfK consumer confidence for November comes in better-than-expected at -24 versus -30 in October. A rise above $1.257 will likely target the mid-August low at $1.2617.
The current upside momentum should prevail while Wednesday’s low and the 200-day SMA at $1.2455 to $1.245 underpin. Only a currently unexpected drop through this support zone would engage the early November high at $1.2428.
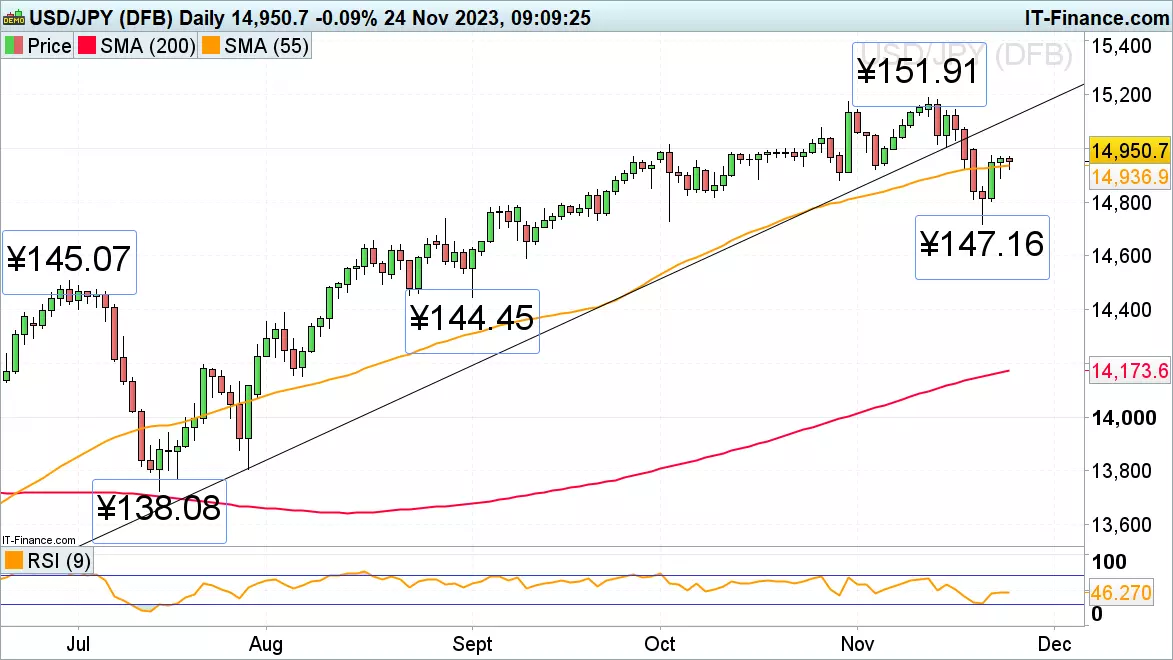
USD/JPY recovery is ongoing
USD/JPY’s swift descent from marginally below its October 2022 peak at ¥151.95 to this week’s ¥147.16 low has been followed by a bounce back to Wednesday’s ¥149.75 high which remains in sight.
With Japan’s October month-on-month (MoM) inflation seeing its highest jump in a decade by 0.7% and year-on-year (YoY) inflation rising to 3.3% while US yields are bouncing back, USD/JPY is likely to head back up again.
A rise above ¥149.75 would eye the early October peak at ¥150.16. Further potential minor resistance can be spotted at the 26 October high at ¥150.78. Minor support below the 55-day SMA at ¥149.37 can be found at the late October low at ¥148.81.
IGA, may distribute information/research produced by its respective foreign affiliates within the IG Group of companies pursuant to an arrangement under Regulation 32C of the Financial Advisers Regulations. Where the research is distributed in Singapore to a person who is not an Accredited Investor, Expert Investor or an Institutional Investor, IGA accepts legal responsibility for the contents of the report to such persons only to the extent required by law. Singapore recipients should contact IGA at 6390 5118 for matters arising from, or in connection with the information distributed.
The information/research herein is prepared by IG Asia Pte Ltd (IGA) and its foreign affiliated companies (collectively known as the IG Group) and is intended for general circulation only. It does not take into account the specific investment objectives, financial situation, or particular needs of any particular person. You should take into account your specific investment objectives, financial situation, and particular needs before making a commitment to trade, including seeking advice from an independent financial adviser regarding the suitability of the investment, under a separate engagement, as you deem fit.
No representation or warranty is given as to the accuracy or completeness of this information. Consequently, any person acting on it does so entirely at their own risk. Please see important Research Disclaimer.
Please also note that the information does not contain a record of our trading prices, or an offer of, or solicitation for, a transaction in any financial instrument. Any views and opinions expressed may be changed without an update.

Start trading forex today
Trade the largest and most volatile financial market in the world.
- Spreads start at just 0.6 points on EUR/USD
- Analyse market movements with our essential selection of charts
- Speculate from a range of platforms, including on mobile
Live prices on most popular markets
- Forex
- Shares
- Indices
See more forex live prices
See more shares live prices
Prices above are subject to our website terms and agreements. Prices are indicative only. All shares prices are delayed by at least 15 mins.
See more indices live prices
Prices above are subject to our website terms and agreements. Prices are indicative only. All shares prices are delayed by at least 20 mins.
