EUR/USD, GBP/USD and AUD/USD trade in low volatility ahead of Wednesday’s FOMC meeting
Outlook on EUR/USD, GBP/USD and AUD/USD ahead of this week’s Fed, BoE and BoJ monetary policy meetings.


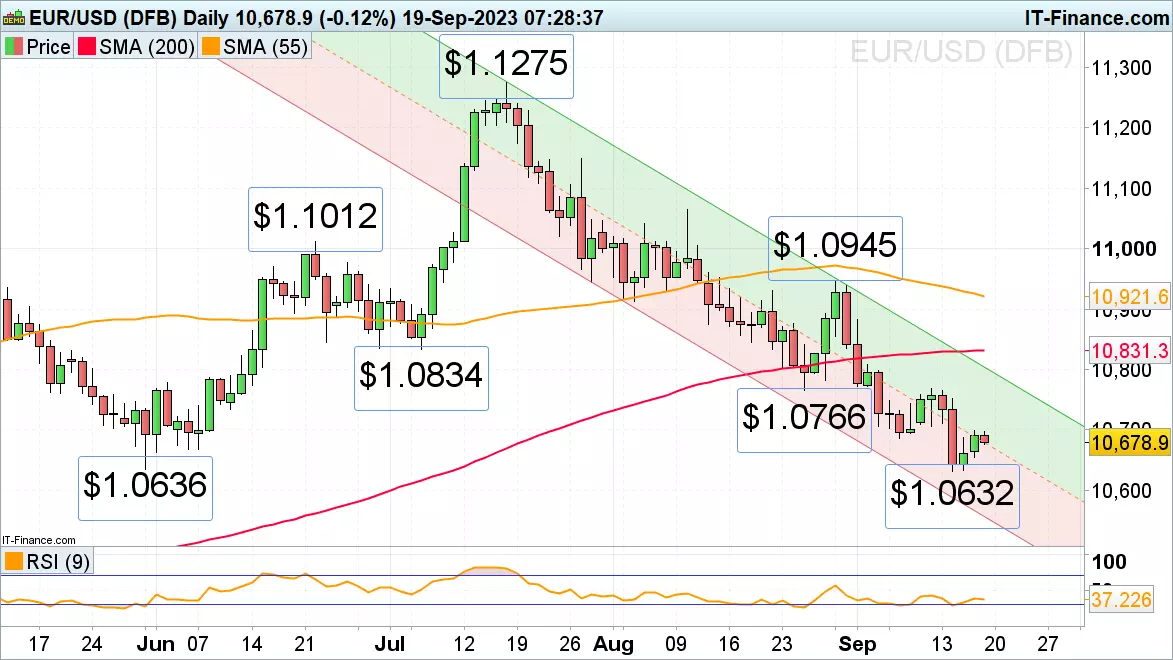
EUR/USD hovers above its 3 ½ month low
EUR/USD continues to hover above its $1.0636 to $1.0632 May and current September lows as traders await Wednesday’s Federal Open Market Committee (FOMC) meeting. At it the Federal Reserve (Fed) is expected to keep its rates on hold.
A potential rise above Monday’s $1.0699 high is likely to fizzle out ahead of the $1.0766 to $1.0769 late August low and last week’s high.
A fall through and daily chart close below Thursday’s low at $1.0632 could lead to a tumble towards the January and March lows at $1.0516 to $1.0484.
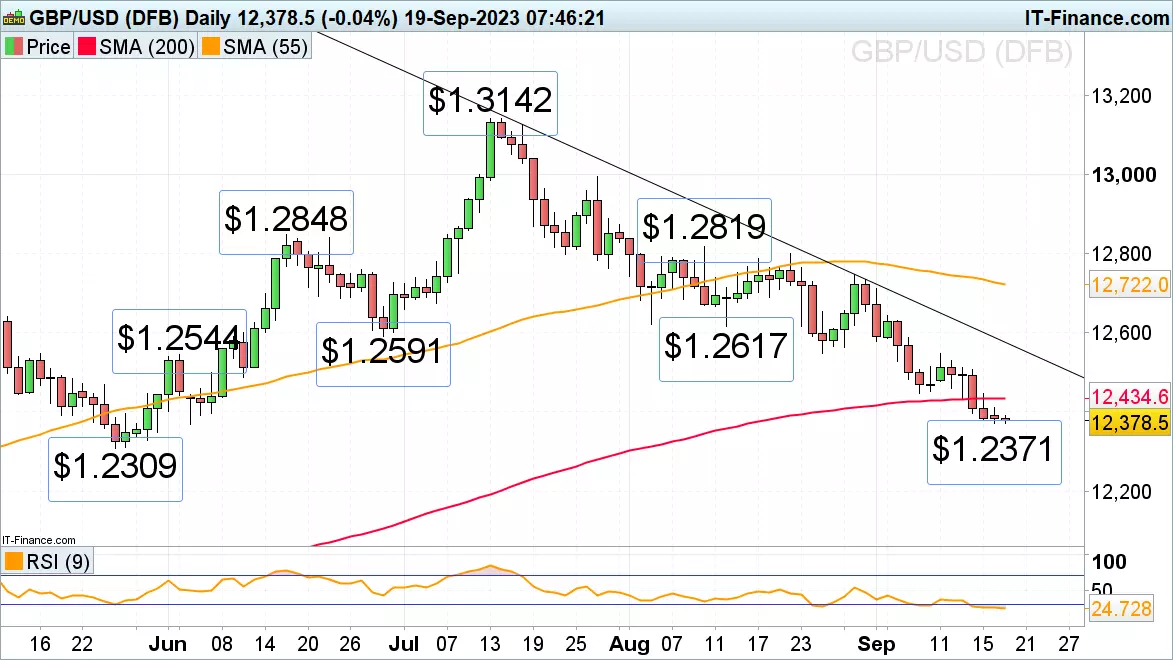
GBP/USD continues to slide but loses downside momentum
GBP/USD descent is ongoing but is losing downside momentum ahead of Thursday’s Bank of England (BoE) anticipated rate hike to 5.50%.
The cross still trades below its 200-day simple moving average (SMA) at $1.2434, which may act as minor resistance, and approaches its June low at $1.2369. A fall through it would target the May low at $1.2309.
Minor resistance above the 200-day SMA remains to be seen at the 7 September low at $1.2446 and further up around the $1.2549 late August low and last Monday’s high.
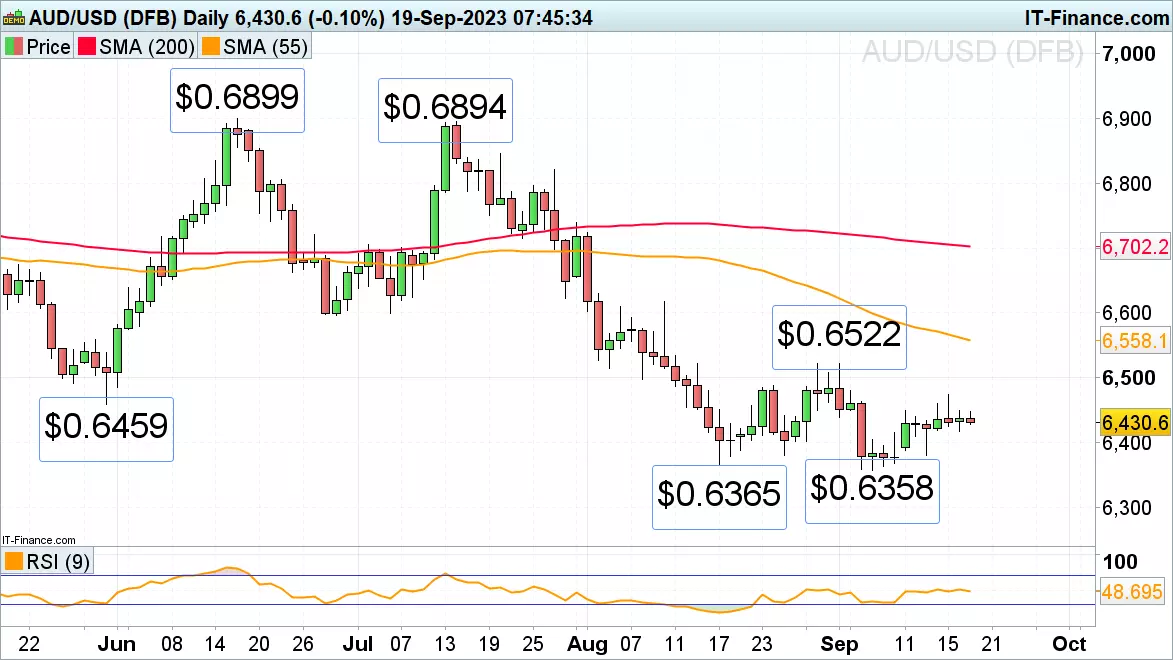
AUD/USD continues to range trade despite RBA minutes
AUD/USD remains side-lined and trades towards the middle of its one-month trading range between $0.6522 to $0.6358 following the Reserve Bank of Australia’s (RBA) minutes. They showed that the central bank considered another rate hike before deciding to keep its cash rate unchanged at 4.1% for the third consecutive month.
Further low volatility range trading is at hand ahead of Wednesday’s US FOMC meeting at which the central bank is expected to keep rates on hold but may hint at another rate hike being in the pipeline later in the year.
A rise above last week’s high at $0.6473 would eye the 24 August $0.6488 high whereas a fall through Monday’s low at $0.6417 could provoke a slip to the $0.6381 low seen last week.
IGA, may distribute information/research produced by its respective foreign affiliates within the IG Group of companies pursuant to an arrangement under Regulation 32C of the Financial Advisers Regulations. Where the research is distributed in Singapore to a person who is not an Accredited Investor, Expert Investor or an Institutional Investor, IGA accepts legal responsibility for the contents of the report to such persons only to the extent required by law. Singapore recipients should contact IGA at 6390 5118 for matters arising from, or in connection with the information distributed.
The information/research herein is prepared by IG Asia Pte Ltd (IGA) and its foreign affiliated companies (collectively known as the IG Group) and is intended for general circulation only. It does not take into account the specific investment objectives, financial situation, or particular needs of any particular person. You should take into account your specific investment objectives, financial situation, and particular needs before making a commitment to trade, including seeking advice from an independent financial adviser regarding the suitability of the investment, under a separate engagement, as you deem fit.
No representation or warranty is given as to the accuracy or completeness of this information. Consequently, any person acting on it does so entirely at their own risk. Please see important Research Disclaimer.
Please also note that the information does not contain a record of our trading prices, or an offer of, or solicitation for, a transaction in any financial instrument. Any views and opinions expressed may be changed without an update.

Start trading forex today
Trade the largest and most volatile financial market in the world.
- Spreads start at just 0.6 points on EUR/USD
- Analyse market movements with our essential selection of charts
- Speculate from a range of platforms, including on mobile
Live prices on most popular markets
- Forex
- Shares
- Indices
See more forex live prices
See more shares live prices
Prices above are subject to our website terms and agreements. Prices are indicative only. All shares prices are delayed by at least 15 mins.
See more indices live prices
Prices above are subject to our website terms and agreements. Prices are indicative only. All shares prices are delayed by at least 20 mins.
