EUR/USD, GBP/USD advance while USD/JPY slips on weaker US dollar
Outlook on EUR/USD, GBP/USD and USD/JPY amid rising US yields.

EUR/USD flirts with last week’s $1.0965 high
EUR/USD pushes higher as US market participants return from a prolonged Thanksgiving weekend.
The cross flirts with its four-month high at $1.0965, above which beckon the late-June high at $1.1012 and the August peak at $1.1065.
A bullish continuation remains the most likely scenario as long as Wednesday’s low at $1.0853 underpins. Minor support above that low comes in around Wednesday’s $1.0923 high.

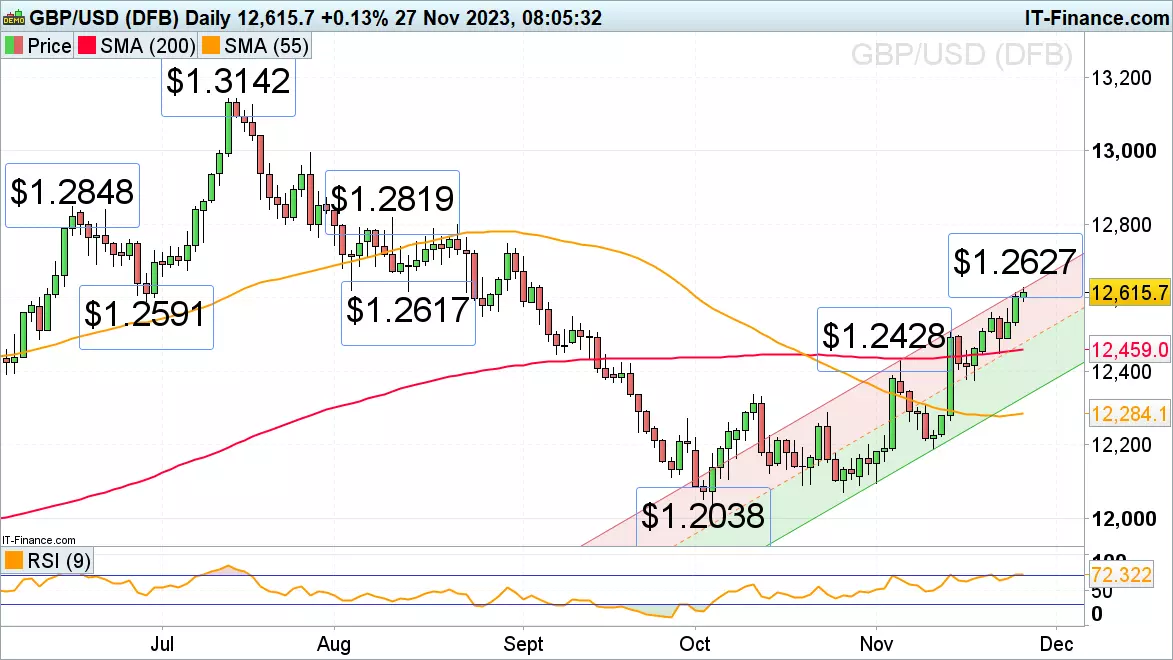
GBP/USD advances to near three-month highs
GBP/USD is trading in near three-month highs as the greenback continues to weaken. The next upside target is the late-August peak at $1.2746.
Minor support can be found around the late-June low at $1.2591, Tuesday’s high at $1.2559 and the mid-November high at $1.2506.
The medium-term uptrend will remain valid while Wednesday’s low and the 200-day simple moving average (SMA) at $1.2459 to $1.245 underpin.
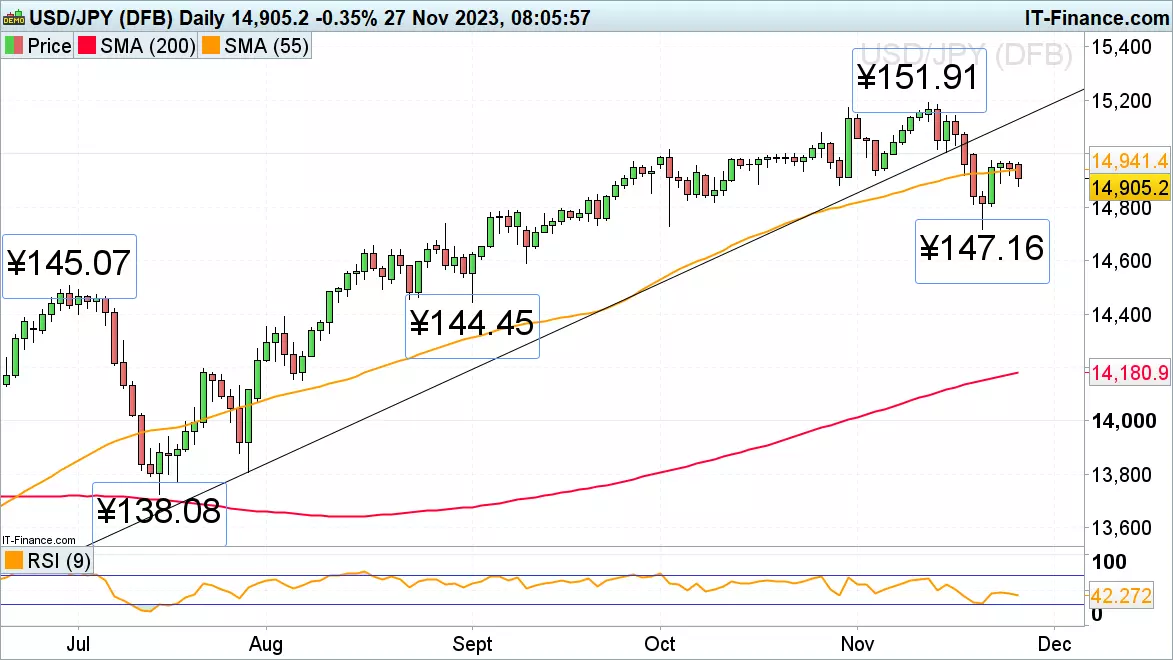
USD/JPY loses upside momentum
USD/JPY’s bounce off last week’s low at ¥147.16 took it to Wednesday’s high at ¥149.75 before consolidating. Earlier this morning the cross began to keel over and slip back to the late-October low at ¥148.81.
Further minor support comes in at the 10 October low at ¥148.17 and at the early October trough at ¥147.29 ahead of last week’s ¥147.16 low.
Only a rise above ¥149.75 would target the early-October peak at ¥150.16. Further potential minor resistance can be spotted at the 26 October high at ¥150.78.
IGA, may distribute information/research produced by its respective foreign affiliates within the IG Group of companies pursuant to an arrangement under Regulation 32C of the Financial Advisers Regulations. Where the research is distributed in Singapore to a person who is not an Accredited Investor, Expert Investor or an Institutional Investor, IGA accepts legal responsibility for the contents of the report to such persons only to the extent required by law. Singapore recipients should contact IGA at 6390 5118 for matters arising from, or in connection with the information distributed.
The information/research herein is prepared by IG Asia Pte Ltd (IGA) and its foreign affiliated companies (collectively known as the IG Group) and is intended for general circulation only. It does not take into account the specific investment objectives, financial situation, or particular needs of any particular person. You should take into account your specific investment objectives, financial situation, and particular needs before making a commitment to trade, including seeking advice from an independent financial adviser regarding the suitability of the investment, under a separate engagement, as you deem fit.
No representation or warranty is given as to the accuracy or completeness of this information. Consequently, any person acting on it does so entirely at their own risk. Please see important Research Disclaimer.
Please also note that the information does not contain a record of our trading prices, or an offer of, or solicitation for, a transaction in any financial instrument. Any views and opinions expressed may be changed without an update.

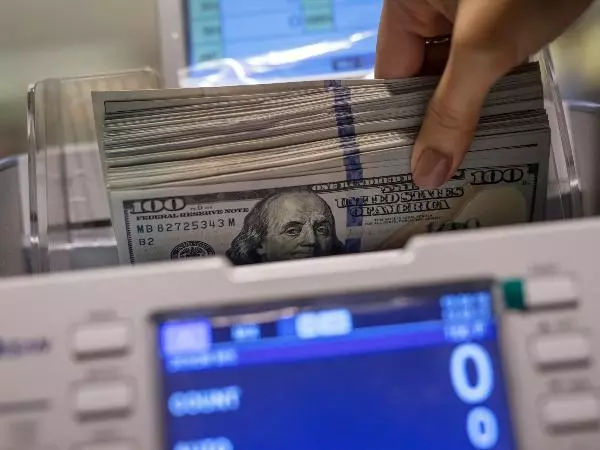
Start trading forex today
Trade the largest and most volatile financial market in the world.
- Spreads start at just 0.6 points on EUR/USD
- Analyse market movements with our essential selection of charts
- Speculate from a range of platforms, including on mobile
Live prices on most popular markets
- Forex
- Shares
- Indices
See more forex live prices
See more shares live prices
Prices above are subject to our website terms and agreements. Prices are indicative only. All shares prices are delayed by at least 15 mins.
See more indices live prices
Prices above are subject to our website terms and agreements. Prices are indicative only. All shares prices are delayed by at least 20 mins.
