EUR/USD, EUR/GBP and AUD/USD drop as RBA holds rates steady
Outlook on EUR/USD, EUR/GBP and AUD/USD as the euro slips on brought forward rate cut expectations and the US dollar regains some recently lost ground.


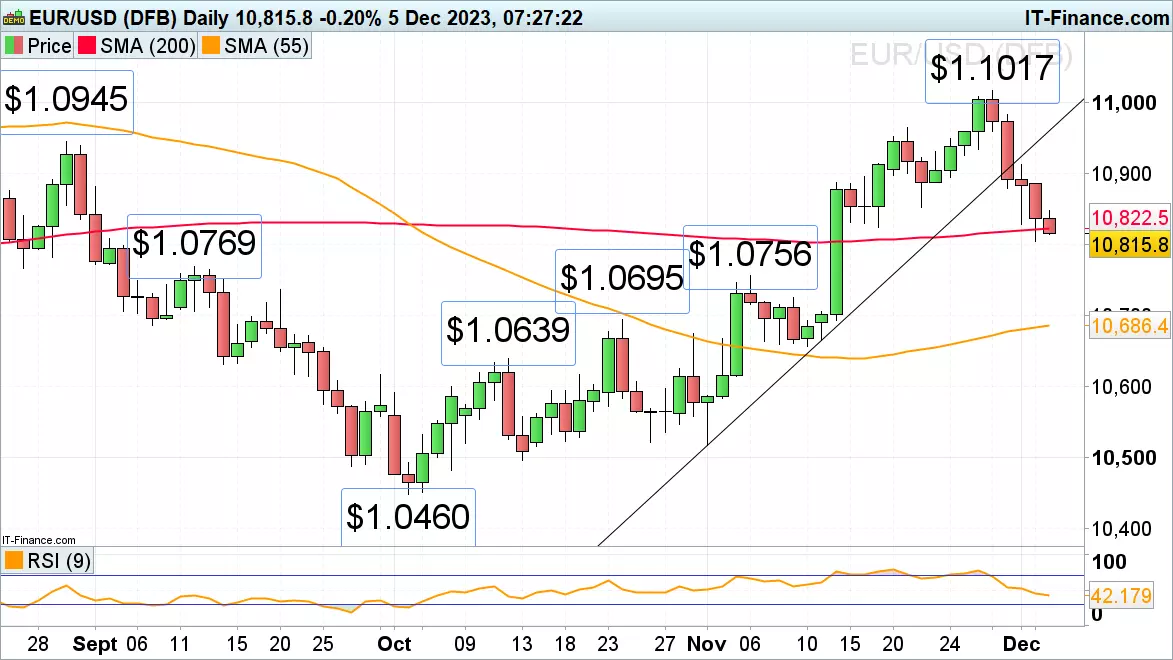
EUR/USD weighs on 200-day simple moving average
EUR/USD's reversal off Wednesday’s four-month high at $1.1017 on softer eurozone inflation, which brought forward European Central Bank (ECB) rate cut expectations to between 125 to 150 basis points (bps) next year, led to four straight days of losses and the 200-day simple moving average (SMA) at $1.0822 being slid through. A daily chart close below it would indicate that a top is being formed with the mid-September and early-November highs at $1.0769 to $1.0756 eyed.
Minor resistance above the 22 November low at $1.0853 can be spotted at Monday’s $1.0886 high and also at Friday’s $1.0912 high.
Further up the $1.0945 late-August high also represents a possible resistance level, together with the 21 November high at $1.0965.
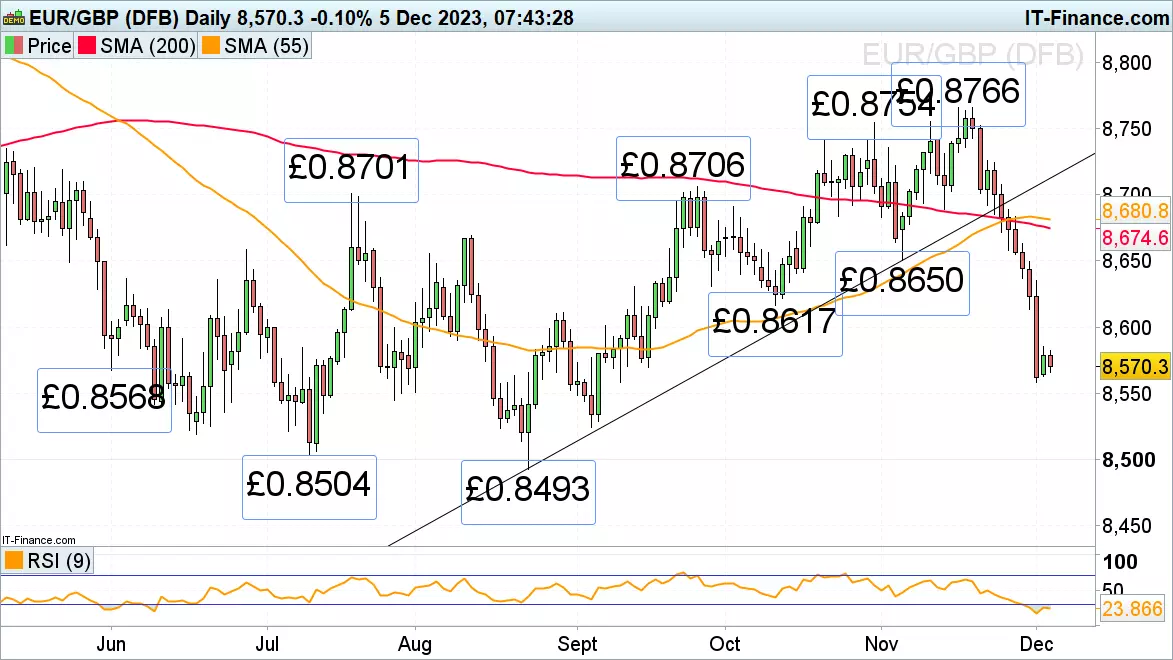
EUR/GBP’s sharp reversal off its six-month high nears its mid-September low
Over the past few weeks EUR/GBP has swiftly come off its six-month high at £0.8766 amid fresh signals that the ECB will start cutting interest rates before the Bank of England (BoE), following the latest comments from BoE’s hawks that interest rates may stay elevated for longer. In November the currency pair saw its biggest monthly loss since May.
The early-June and mid-September lows at £0.857 to £0.8568 are now within reach and may offer short-term support, together with the late July low at £0.8545. If not, the July and August lows at £0.8504 to £0.8493 would be back in sight.
Minor resistance now sits between the late-August high and the October low at £0.861 to £0.865.
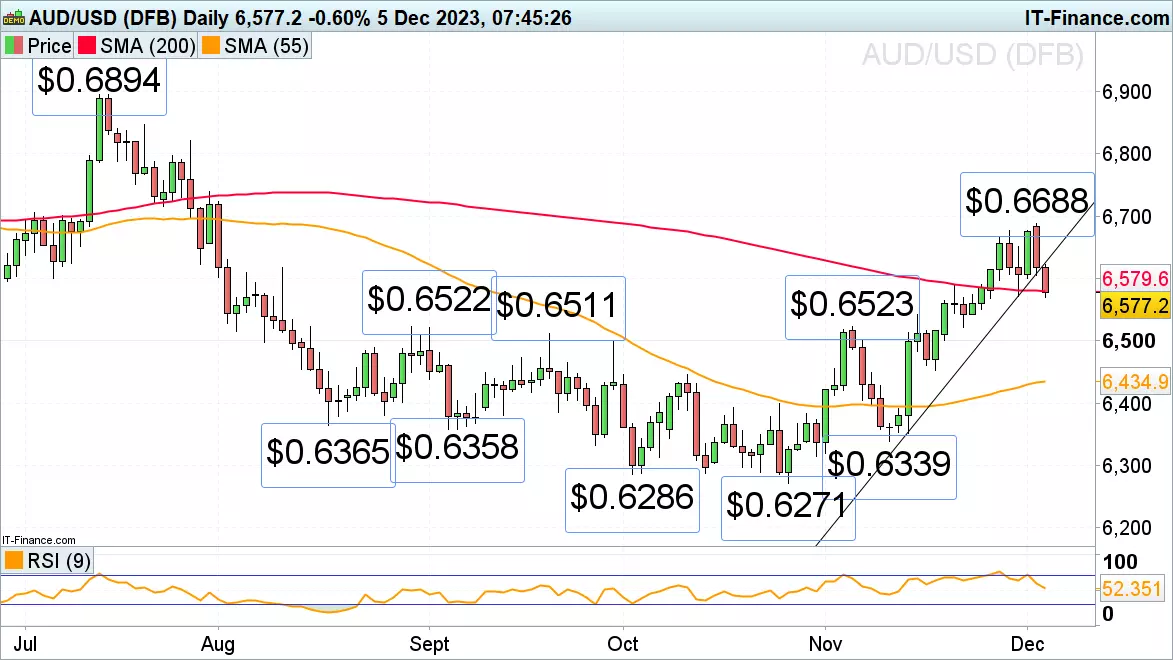
AUD/USD comes off its 3 ½ month high
Monday’s AUD/USD advance to a new 3 ½ month high at $0.6688 has been followed by a fall through its November-to-December uptrend line at $0.6626 as the Reserve Bank of Australia (RBA) kept its rates unchanged at 4.35%, in line with market expectations.
A drop towards the August, September and early November highs at $0.6523 to $0.6511 now seems to be on the cards. This support area is expected to hold, at least short-term, though. For now the 200-day SMA and Thursday’s low at $0.6608 to $0.6571 offer immediate support.
Resistance comes in along the breached November-to-December accelerated uptrend line, because of inverse polarity a resistance line, at $0.6626.
IGA, may distribute information/research produced by its respective foreign affiliates within the IG Group of companies pursuant to an arrangement under Regulation 32C of the Financial Advisers Regulations. Where the research is distributed in Singapore to a person who is not an Accredited Investor, Expert Investor or an Institutional Investor, IGA accepts legal responsibility for the contents of the report to such persons only to the extent required by law. Singapore recipients should contact IGA at 6390 5118 for matters arising from, or in connection with the information distributed.
The information/research herein is prepared by IG Asia Pte Ltd (IGA) and its foreign affiliated companies (collectively known as the IG Group) and is intended for general circulation only. It does not take into account the specific investment objectives, financial situation, or particular needs of any particular person. You should take into account your specific investment objectives, financial situation, and particular needs before making a commitment to trade, including seeking advice from an independent financial adviser regarding the suitability of the investment, under a separate engagement, as you deem fit.
No representation or warranty is given as to the accuracy or completeness of this information. Consequently, any person acting on it does so entirely at their own risk. Please see important Research Disclaimer.
Please also note that the information does not contain a record of our trading prices, or an offer of, or solicitation for, a transaction in any financial instrument. Any views and opinions expressed may be changed without an update.

Start trading forex today
Trade the largest and most volatile financial market in the world.
- Spreads start at just 0.6 points on EUR/USD
- Analyse market movements with our essential selection of charts
- Speculate from a range of platforms, including on mobile
Live prices on most popular markets
- Forex
- Shares
- Indices
See more forex live prices
See more shares live prices
Prices above are subject to our website terms and agreements. Prices are indicative only. All shares prices are delayed by at least 15 mins.
See more indices live prices
Prices above are subject to our website terms and agreements. Prices are indicative only. All shares prices are delayed by at least 20 mins.
