EUR/GBP stable but GBP/USD and AUD/USD slip to multi-month lows on rising US yields and dollar
Outlook on EUR/GBP, GBP/USD and AUD/USD as ‘rates higher for longer’ is expected to last well into 2024.


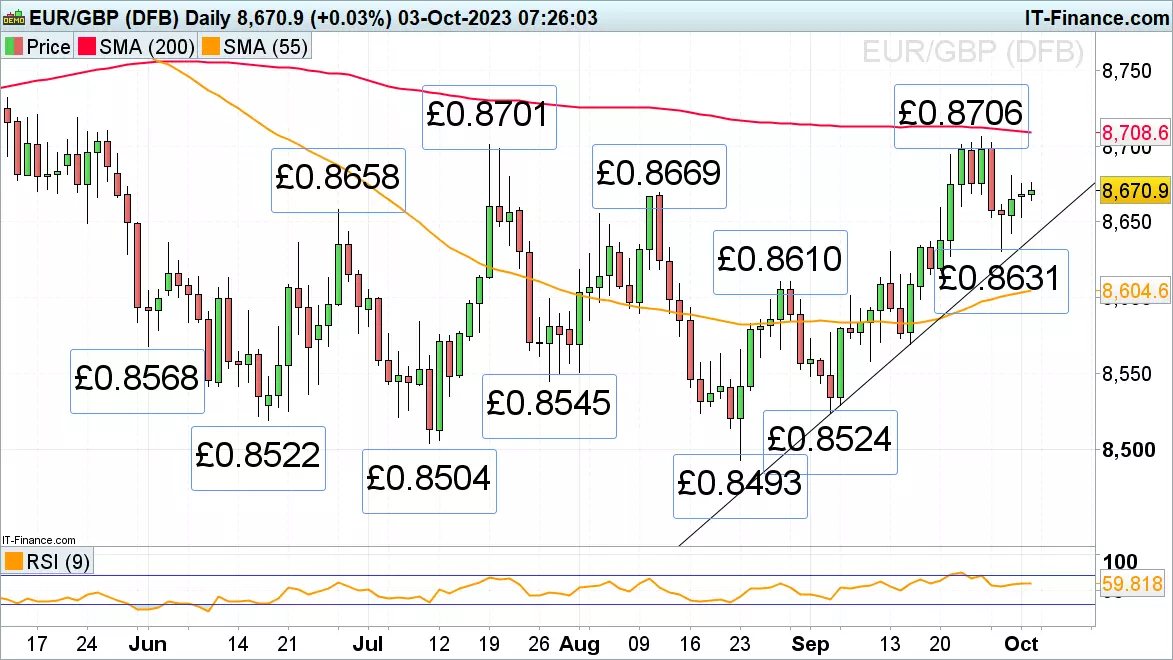
EUR/GBP remains bid while above £0.8631
EUR/GBP's fall from its £0.8706 September peak made last week took it to Thursday’s £0.8631 low from where it is recovering as Germany is shut for reunification day and the British pounds weakens during the UK Conservative party conference which is accompanied by rail and tube strikes.
A rise above Friday’s high at £0.868 could lead to the September peak and the 200-day simple moving average (SMA) at £0.8706 to £0.8719 being revisited.
Support below Monday’s low at £0.8654 is seen along the September-to-October uptrend line at £0.8638 and also at last week’s low at £0.8631.
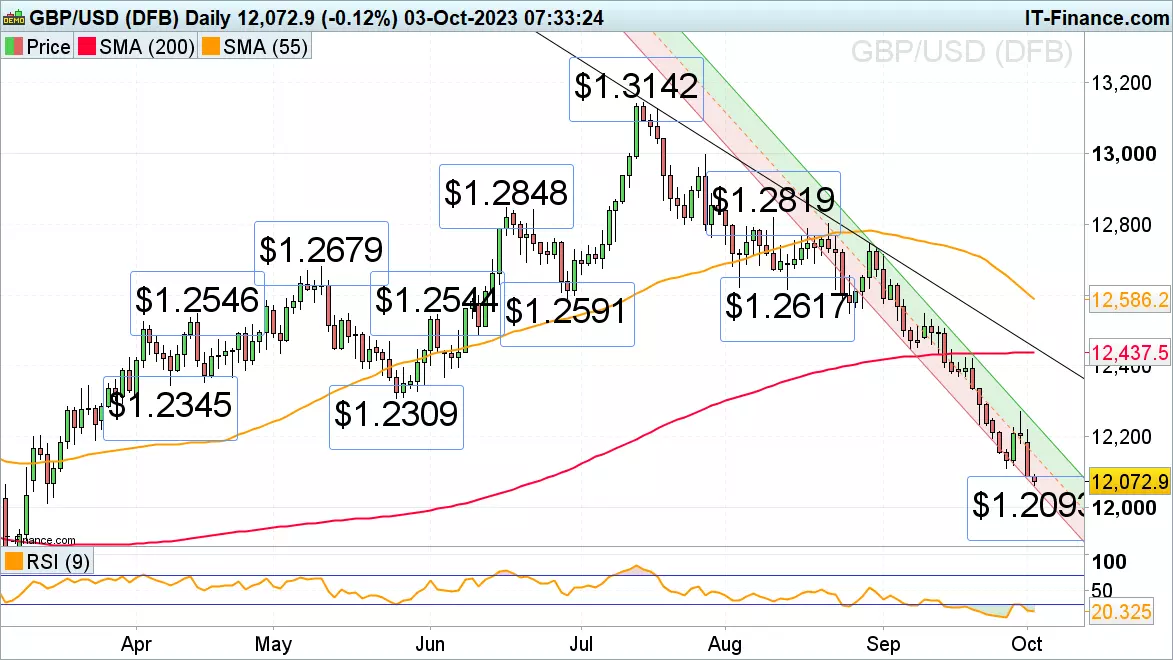
GBP/USD drops to new six-month low
GBP/USD has resumed its descent and swiftly fell to a new six-month low at $1.2093 as the US dollar continues to appreciate amid rising US yields, solid manufacturing purchasing managers index (PMI) and as investors believe that the ‘rates higher for longer’ period will last well into 2024 following mixed hawkish and dovish Federal Reserve (Fed) committee member comments.
The mid-March low at $1.2011 and the minor psychological $1.20 mark are thus next in sight.
Minor resistance sits at last week’s low at $1.2111. The September downtrend channel resistance line at $1.224 together with Friday’s high at $1.2271 represent key resistance. While below it, the steep downtrend remains in place.
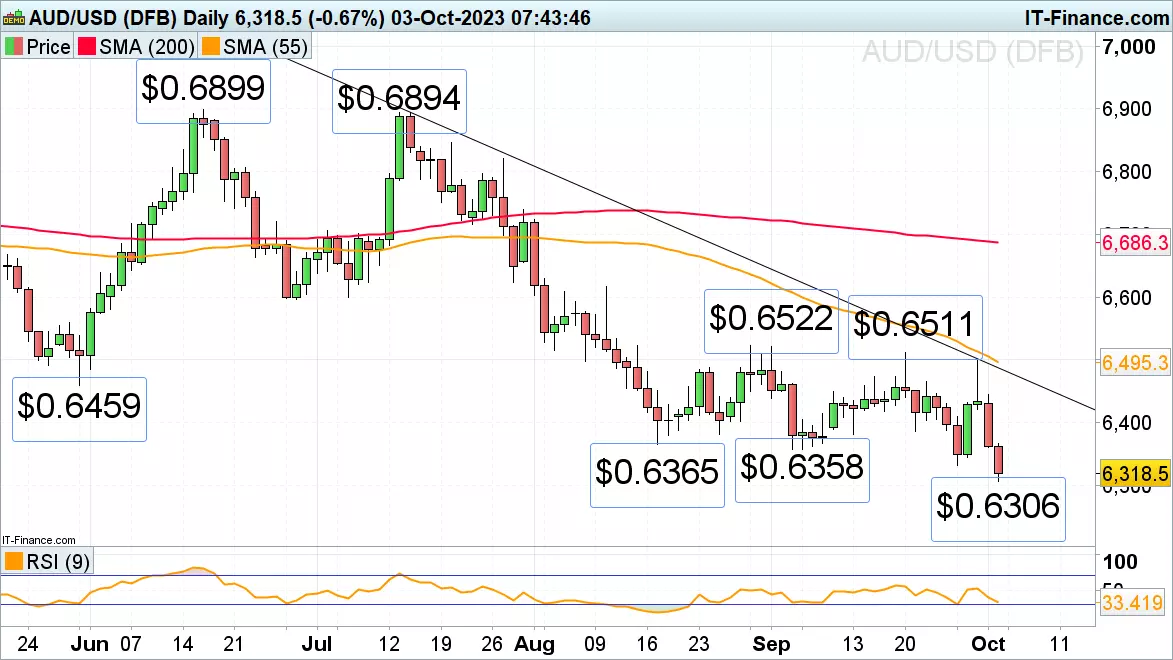
AUD/USD falls to eleven-month low
The appreciating US dollar and the fact that the new Reserve Bank of Australia (RBA) governor Michele Bullock during her first meeting kept the central bank’s cash rate unchanged at 4.1% led to AUD/USD dropping to an eleven-month low at $0.6306.
The next lower potential downside targets are the $0.6273 November 2022 low and the $0.6171 October 2022 trough.
Strong resistance above last week’s low at $0.6332 can be found between the mid-August low at $0.6365 and the 21 September low at $0.6385. While the cross remains below its $0.6511 to $0.6522 late-August and September highs, the medium-term downtrend will remain intact.
IGA, may distribute information/research produced by its respective foreign affiliates within the IG Group of companies pursuant to an arrangement under Regulation 32C of the Financial Advisers Regulations. Where the research is distributed in Singapore to a person who is not an Accredited Investor, Expert Investor or an Institutional Investor, IGA accepts legal responsibility for the contents of the report to such persons only to the extent required by law. Singapore recipients should contact IGA at 6390 5118 for matters arising from, or in connection with the information distributed.
The information/research herein is prepared by IG Asia Pte Ltd (IGA) and its foreign affiliated companies (collectively known as the IG Group) and is intended for general circulation only. It does not take into account the specific investment objectives, financial situation, or particular needs of any particular person. You should take into account your specific investment objectives, financial situation, and particular needs before making a commitment to trade, including seeking advice from an independent financial adviser regarding the suitability of the investment, under a separate engagement, as you deem fit.
No representation or warranty is given as to the accuracy or completeness of this information. Consequently, any person acting on it does so entirely at their own risk. Please see important Research Disclaimer.
Please also note that the information does not contain a record of our trading prices, or an offer of, or solicitation for, a transaction in any financial instrument. Any views and opinions expressed may be changed without an update.

Start trading forex today
Trade the largest and most volatile financial market in the world.
- Spreads start at just 0.6 points on EUR/USD
- Analyse market movements with our essential selection of charts
- Speculate from a range of platforms, including on mobile
Live prices on most popular markets
- Forex
- Shares
- Indices
See more forex live prices
See more shares live prices
Prices above are subject to our website terms and agreements. Prices are indicative only. All shares prices are delayed by at least 15 mins.
See more indices live prices
Prices above are subject to our website terms and agreements. Prices are indicative only. All shares prices are delayed by at least 20 mins.
