EUR/GBP slips while GBP/USD rises post UK GDP with USD/CNH remaining side-lined
Outlook on EUR/GBP, GBP/USD and USD/CNH post UK GDP and plethora of China data.

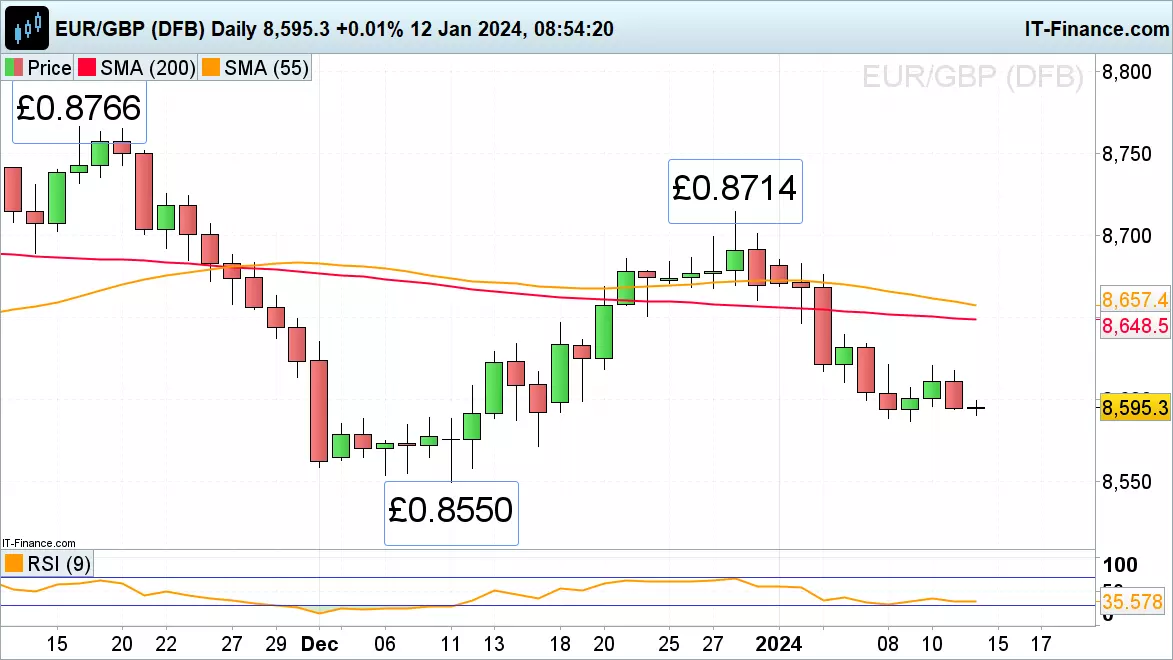
EUR/GBP slips to £0.86 region
EUR/GBP’s drop from its £0.8714 December high has taken it to Tuesday’s £0.8587 low which is back in sight following an improved month-on-month (MoM) UK gross domestic product (GDP) number which was negated by a drop of the three-month average, though.
A fall through £0.8587 would put the 15 December low at £0.8572 on the map and perhaps also the December low at £0.855.
Minor resistance sits at Monday’s £0.8621 high and Friday’s £0.8634 high.
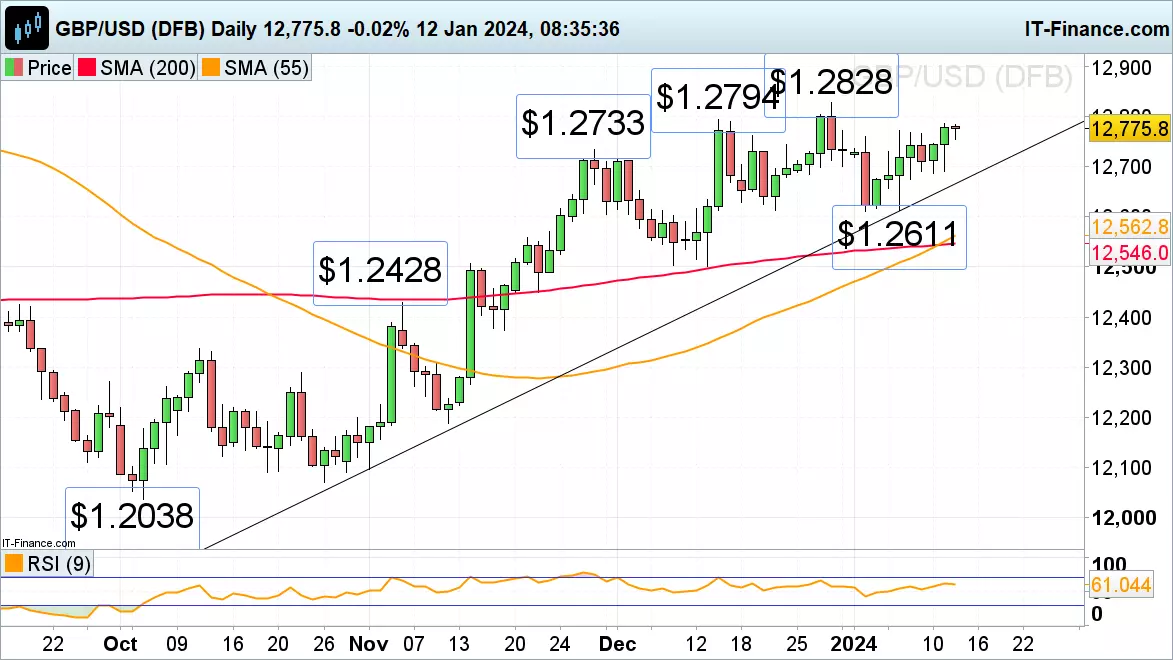
GBP/USD nears mid-December peak
GBP/USD’s rise from its two-week low at $1.2611 is ongoing amid slightly better-than-expected MoM UK GDP data with the mid-December high at $1.2794 and the December five-month peak at $1.2828 representing upside targets.
Upside pressure should remain in play while Wednesday’s low at $1.2687 underpins.
Above it, minor support can be found at Wednesday’s $1.2745 high and below it along the November-to-January uptrend line, 21 December and current January lows at $1.2666 to $1.2611.
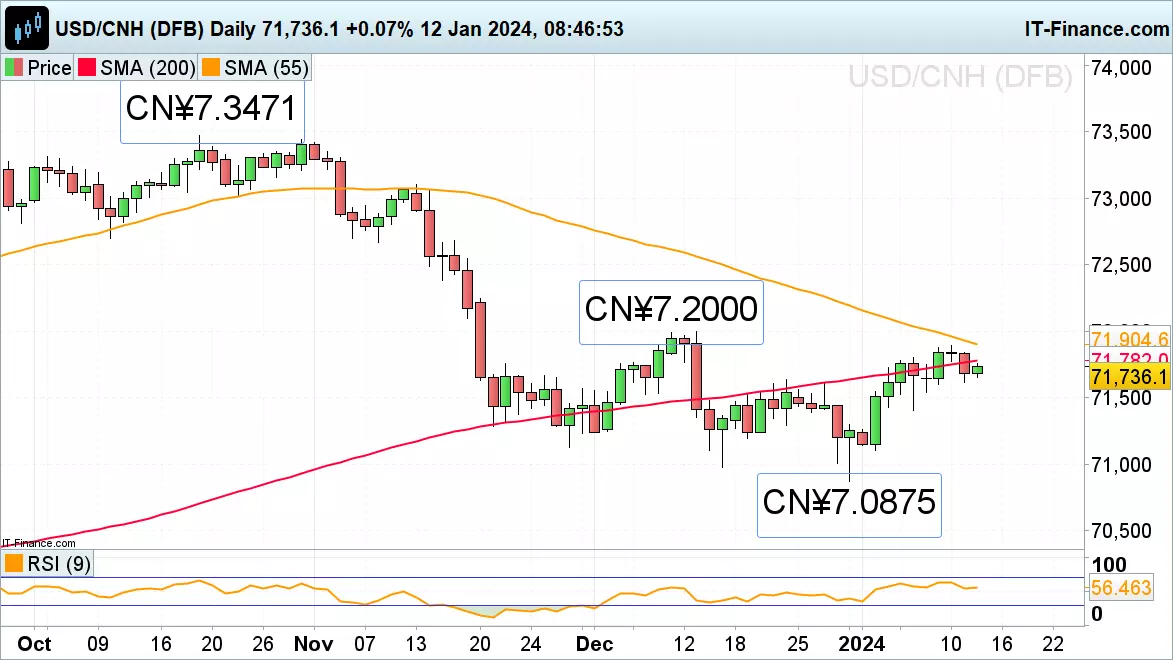
USD/CNH remains in a tight sideways trading range
USD/CNH’s decline from its September CN¥7.3681 one-year high, amid a depreciating greenback, has so far taken the cross to an eight-month low at CN¥7.0875 before the cross recovered and started trading in a low volatility trading range along the 200-day simple moving average (SMA) at CN¥7.1782.
China consumer prices falling for a third straight month while imports rose less than expected but exports growth beat forecasts as producer prices fell more than expected didn’t change the state of affairs on Friday.
The 200-day SMA at CN¥7.1782 currently acts as resistance. While the next higher 55-day SMA and this week’s high at CN¥7.1897 to CN¥7.1905 cap, further sideways trading is at hand. Minor support below Thursday’s CN¥7.1617 low can be spotted at Monday’s CN¥7.1545 low.
IGA, may distribute information/research produced by its respective foreign affiliates within the IG Group of companies pursuant to an arrangement under Regulation 32C of the Financial Advisers Regulations. Where the research is distributed in Singapore to a person who is not an Accredited Investor, Expert Investor or an Institutional Investor, IGA accepts legal responsibility for the contents of the report to such persons only to the extent required by law. Singapore recipients should contact IGA at 6390 5118 for matters arising from, or in connection with the information distributed.
The information/research herein is prepared by IG Asia Pte Ltd (IGA) and its foreign affiliated companies (collectively known as the IG Group) and is intended for general circulation only. It does not take into account the specific investment objectives, financial situation, or particular needs of any particular person. You should take into account your specific investment objectives, financial situation, and particular needs before making a commitment to trade, including seeking advice from an independent financial adviser regarding the suitability of the investment, under a separate engagement, as you deem fit.
No representation or warranty is given as to the accuracy or completeness of this information. Consequently, any person acting on it does so entirely at their own risk. Please see important Research Disclaimer.
Please also note that the information does not contain a record of our trading prices, or an offer of, or solicitation for, a transaction in any financial instrument. Any views and opinions expressed may be changed without an update.

Start trading forex today
Trade the largest and most volatile financial market in the world.
- Spreads start at just 0.6 points on EUR/USD
- Analyse market movements with our essential selection of charts
- Speculate from a range of platforms, including on mobile
Live prices on most popular markets
- Forex
- Shares
- Indices
See more forex live prices
See more shares live prices
Prices above are subject to our website terms and agreements. Prices are indicative only. All shares prices are delayed by at least 15 mins.
See more indices live prices
Prices above are subject to our website terms and agreements. Prices are indicative only. All shares prices are delayed by at least 20 mins.
