AO World looks for better performance at upcoming earnings
AO World is looking to put recent weakness behind it when it reports earnings this week.

Is AO World back on track?
AO World has indeed shown signs of recovery since July, when it reassured investors that it had resolved its issues and was back on track. The company, reported a full-year pre-tax profit of £7.6 million, while on an underlying basis, profits nearly doubled to £45 million.
This positive performance has given AO World the confidence to express its ambition of achieving an underlying profit of 5% of sales in the short and medium term. With last year's turnover standing at £1.4 billion, this target implies a potential profit increase of at least £57 million.
Investors will be eagerly awaiting the company's interim results for the six months ended 30 September 2023.
Analyst ratings for AO World
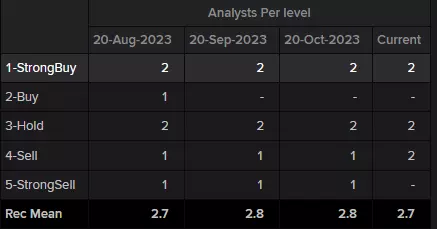
Refinitiv data shows a consensus analyst rating of between ‘buy’ and ‘hold’ for AO World – 2 strong buy, 2 hold and 2 sell - with the mean of estimates suggesting a long-term price target of 83.67 pence for the share. It is where the share is trading as of 20 November 2023.
Technical outlook on the AO World’s share price
The AO World share price, which has risen close to 50% year-to-date, has been range trading since July while so far remaining above its 200-day simple moving average (SMA) at 78.40 pence. It may be back in focus now, following last week’s failure at the share’s 94.20p one-month high.
AO World Daily Candlestick Chart
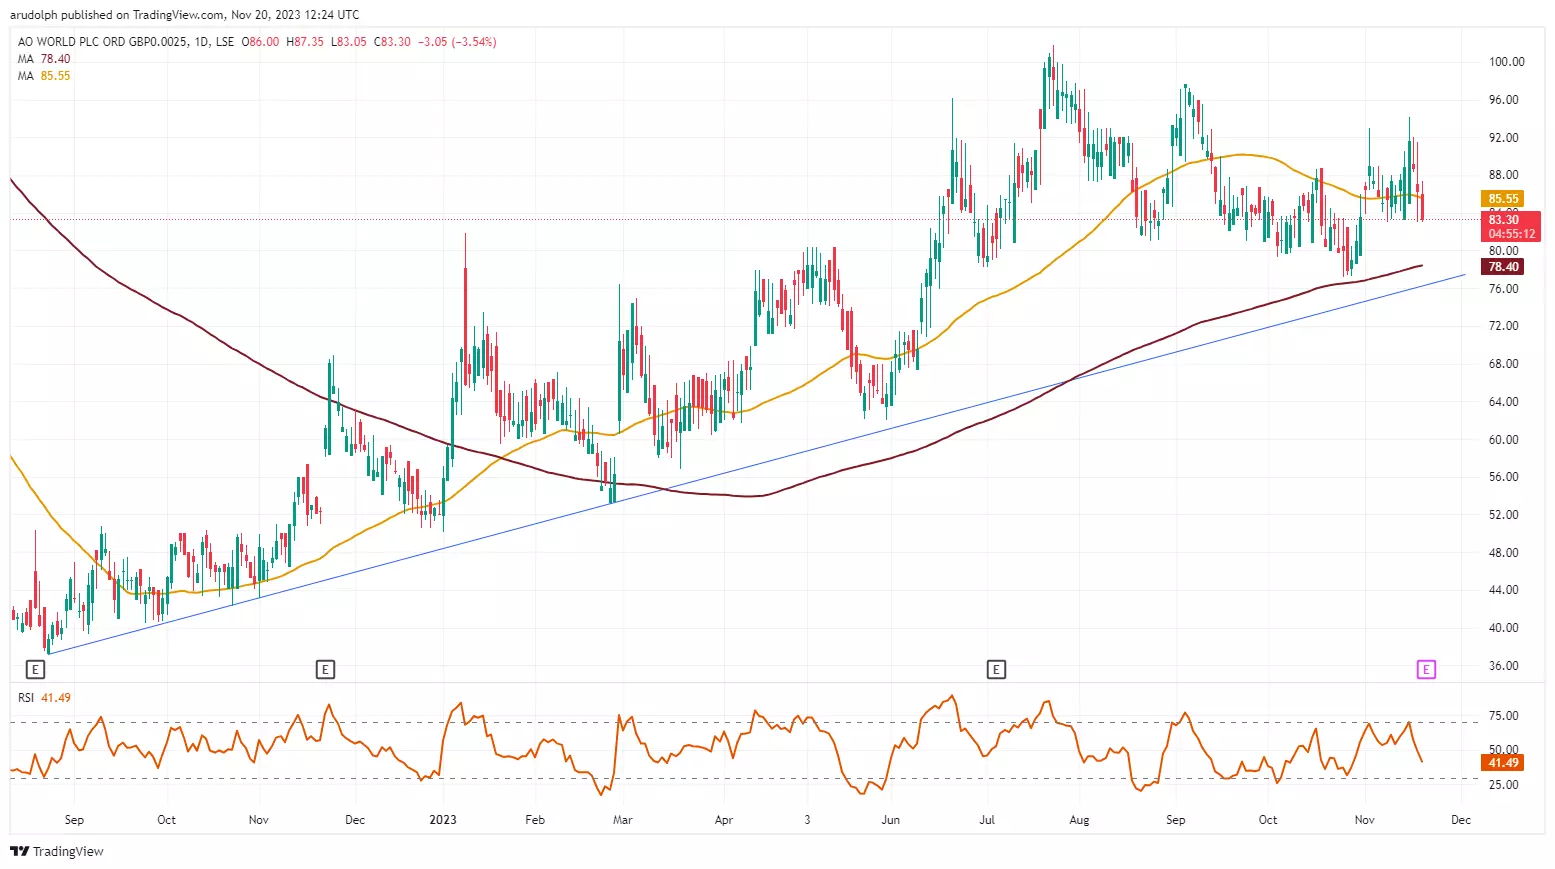
Were AO World’s share price to rise above 94.20p post its first half earnings results out on Tuesday, the July peak at 101.80p would be back in the picture. Further up lurks the January 2022 peak at 114.80p.
AO World Weekly Candlestick Chart
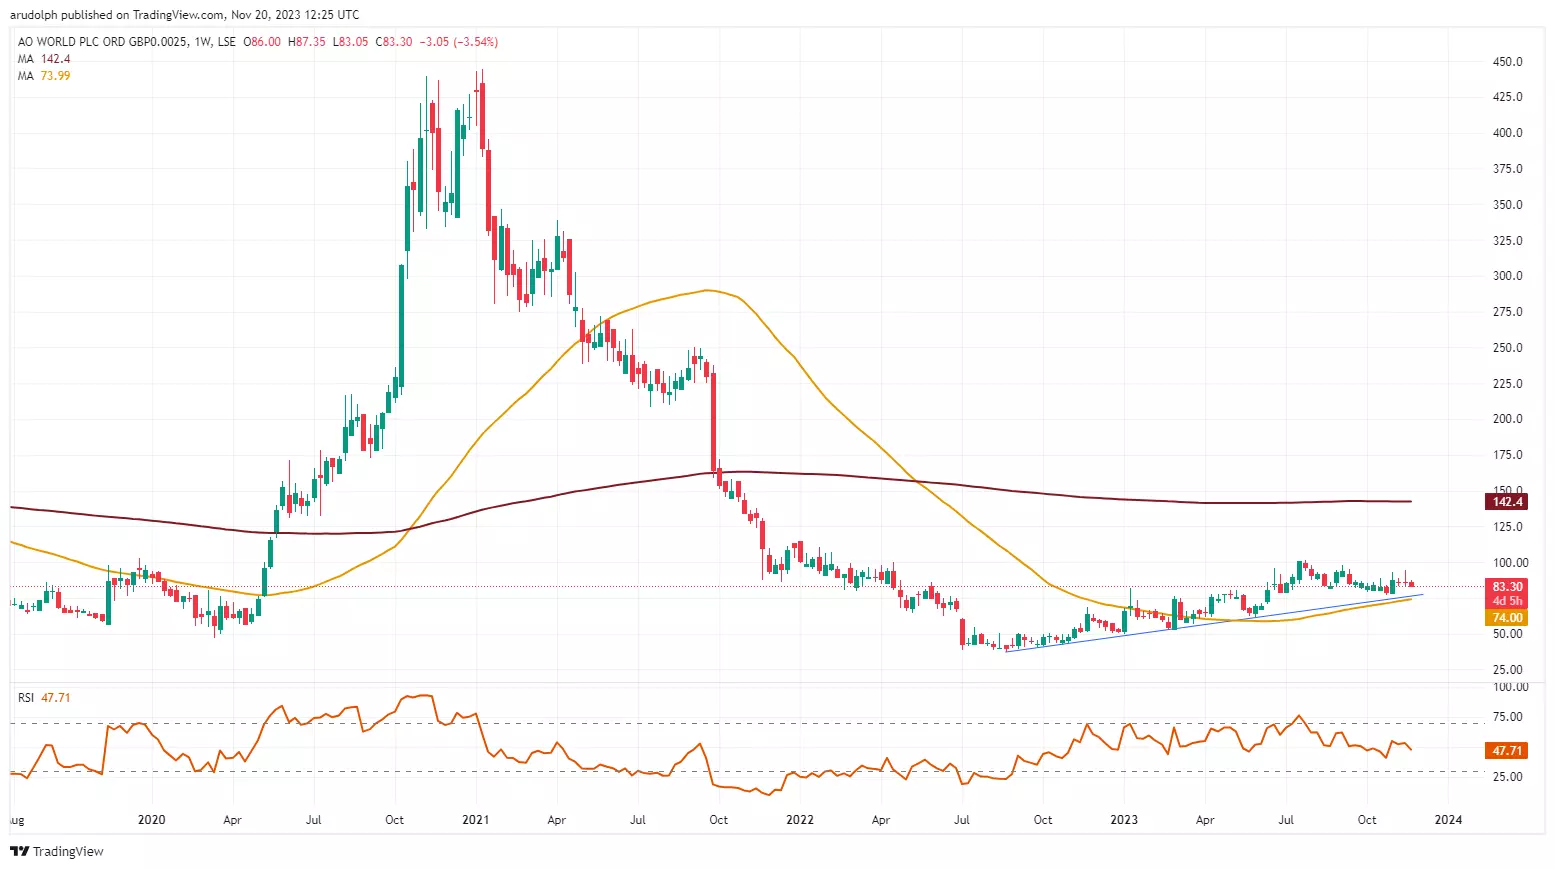
While the 200-day SMA, July and October lows and the 2022-to-2023 uptrend line at 78.40p to 76.25p underpin on a weekly chart closing basis, the long-term uptrend in the AO World share price will remain intact.
IGA, may distribute information/research produced by its respective foreign affiliates within the IG Group of companies pursuant to an arrangement under Regulation 32C of the Financial Advisers Regulations. Where the research is distributed in Singapore to a person who is not an Accredited Investor, Expert Investor or an Institutional Investor, IGA accepts legal responsibility for the contents of the report to such persons only to the extent required by law. Singapore recipients should contact IGA at 6390 5118 for matters arising from, or in connection with the information distributed.
The information/research herein is prepared by IG Asia Pte Ltd (IGA) and its foreign affiliated companies (collectively known as the IG Group) and is intended for general circulation only. It does not take into account the specific investment objectives, financial situation, or particular needs of any particular person. You should take into account your specific investment objectives, financial situation, and particular needs before making a commitment to trade, including seeking advice from an independent financial adviser regarding the suitability of the investment, under a separate engagement, as you deem fit.
No representation or warranty is given as to the accuracy or completeness of this information. Consequently, any person acting on it does so entirely at their own risk. Please see important Research Disclaimer.
Please also note that the information does not contain a record of our trading prices, or an offer of, or solicitation for, a transaction in any financial instrument. Any views and opinions expressed may be changed without an update.

Seize a share opportunity today
Go long or short on thousands of international stocks.
- Increase your market exposure with leverage
- Get spreads from just 0.1% on major global shares
- Trade CFDs straight into order books with direct market access
Live prices on most popular markets
- Forex
- Shares
- Indices
See more forex live prices
See more shares live prices
Prices above are subject to our website terms and agreements. Prices are indicative only. All shares prices are delayed by at least 15 mins.
See more indices live prices
Prices above are subject to our website terms and agreements. Prices are indicative only. All shares prices are delayed by at least 20 mins.
