Beginners’ guide to technical analysis
Technical analysis is a method of predicting the future direction of a market’s price by studying historical chart patterns and formations. Discover the basics of technical analysis and how it differs from fundamental analysis.


Understanding technical analysis
There are a range of ways that traders can perform technical analysis but most will focus on using historical price charts overlaid with technical indicators or oscillators. The aim of technical analysis is to identify recognisable patterns that will help traders find the right time and price point at which to enter and exit the market.
Technical analysis charts will usually show price movement in the form of candlesticks, which illustrate key points about a market’s price in a given period of time:
- The colour of the candlestick denotes whether it has moved up (green) or down (red) in price
- The bars show the opening and closing price
- The wicks show the highest and lowest prices
Discover the 16 candlestick patterns every trader should know
There are many different indicators that technical analysts will use on charts. Some popular technical analysis strategies will utilise moving averages, Fibonacci retracements and Bollinger bands in order to identify price points for entering and exiting trades. But the indicators used will vary from individual to individual, depending on their trading style, the market they’re trading and the timeframe they are looking at.
It is common for technical analysts to test how their strategy would perform – before risking any actual capital – by applying it to a market’s previous price movements. This is called backtesting. It involves taking a chunk of real data from a selection of markets, and running a strategy against it. If the backtesting works, traders and analysts will develop the confidence to use the technical analysis as the basis for entering live positions.
In fact, some traders become so confident in how their strategy will perform that they decide to automate it. Automating a technical analysis strategy involves setting up a series of algorithms that can execute trades with minimal human involvement.
What is the basis of technical analysis?
The basis of technical analysis is in Dow theory, a set of rules created by Charles Dow between 1851 and 1902. The rules guide traders on the principles of market action – including the types of trends, the phases of price movements and the impact of news on the market.
Learn more about Dow theory.
Although modern technical analysis has developed significantly in terms of the technology available and the ability to automate analysis, Dow’s approach is still the core of the practice.
Key assumptions of technical analysis
Broadly speaking technical analysis is based on the key assumptions that:
- The charts tell a story. Proponents of technical analysis believe they can predict future movements based on historic prices. However, it is generally advisable to combine fundamental and technical analysis to ensure you understand the market fully before you place a trade
- Market prices move in trends. According to Dow theory there are three trend timeframes. These are primary movement, which can be a year to several years, secondary reaction, which is anything from ten days to a year, and minor movement, which can be seconds to days
- Historical trends repeat themselves. Analysts believe that price patterns will tend to repeat themselves in the future. So, they’ll look at market’s previous price movements, and use those to decide when to open and close trades to maximise their profits
How is technical analysis used?
Technical analysis is used for both short and long-term trading. A long-term trend investor might use technical indicators to decide when to buy shares for their portfolio, while a short-term day trader could use them to identify quick opportunities for profit.
Timing is a crucial part of successful trading, and technical analysis can help you time your trades to maximise profits and minimise losses.
Technical analysis can be used on almost any market – all you need is a price chart and access to some technical indicators. So, whether you want to trade stocks, indices, forex or cryptocurrencies, technical analysis can be of use.
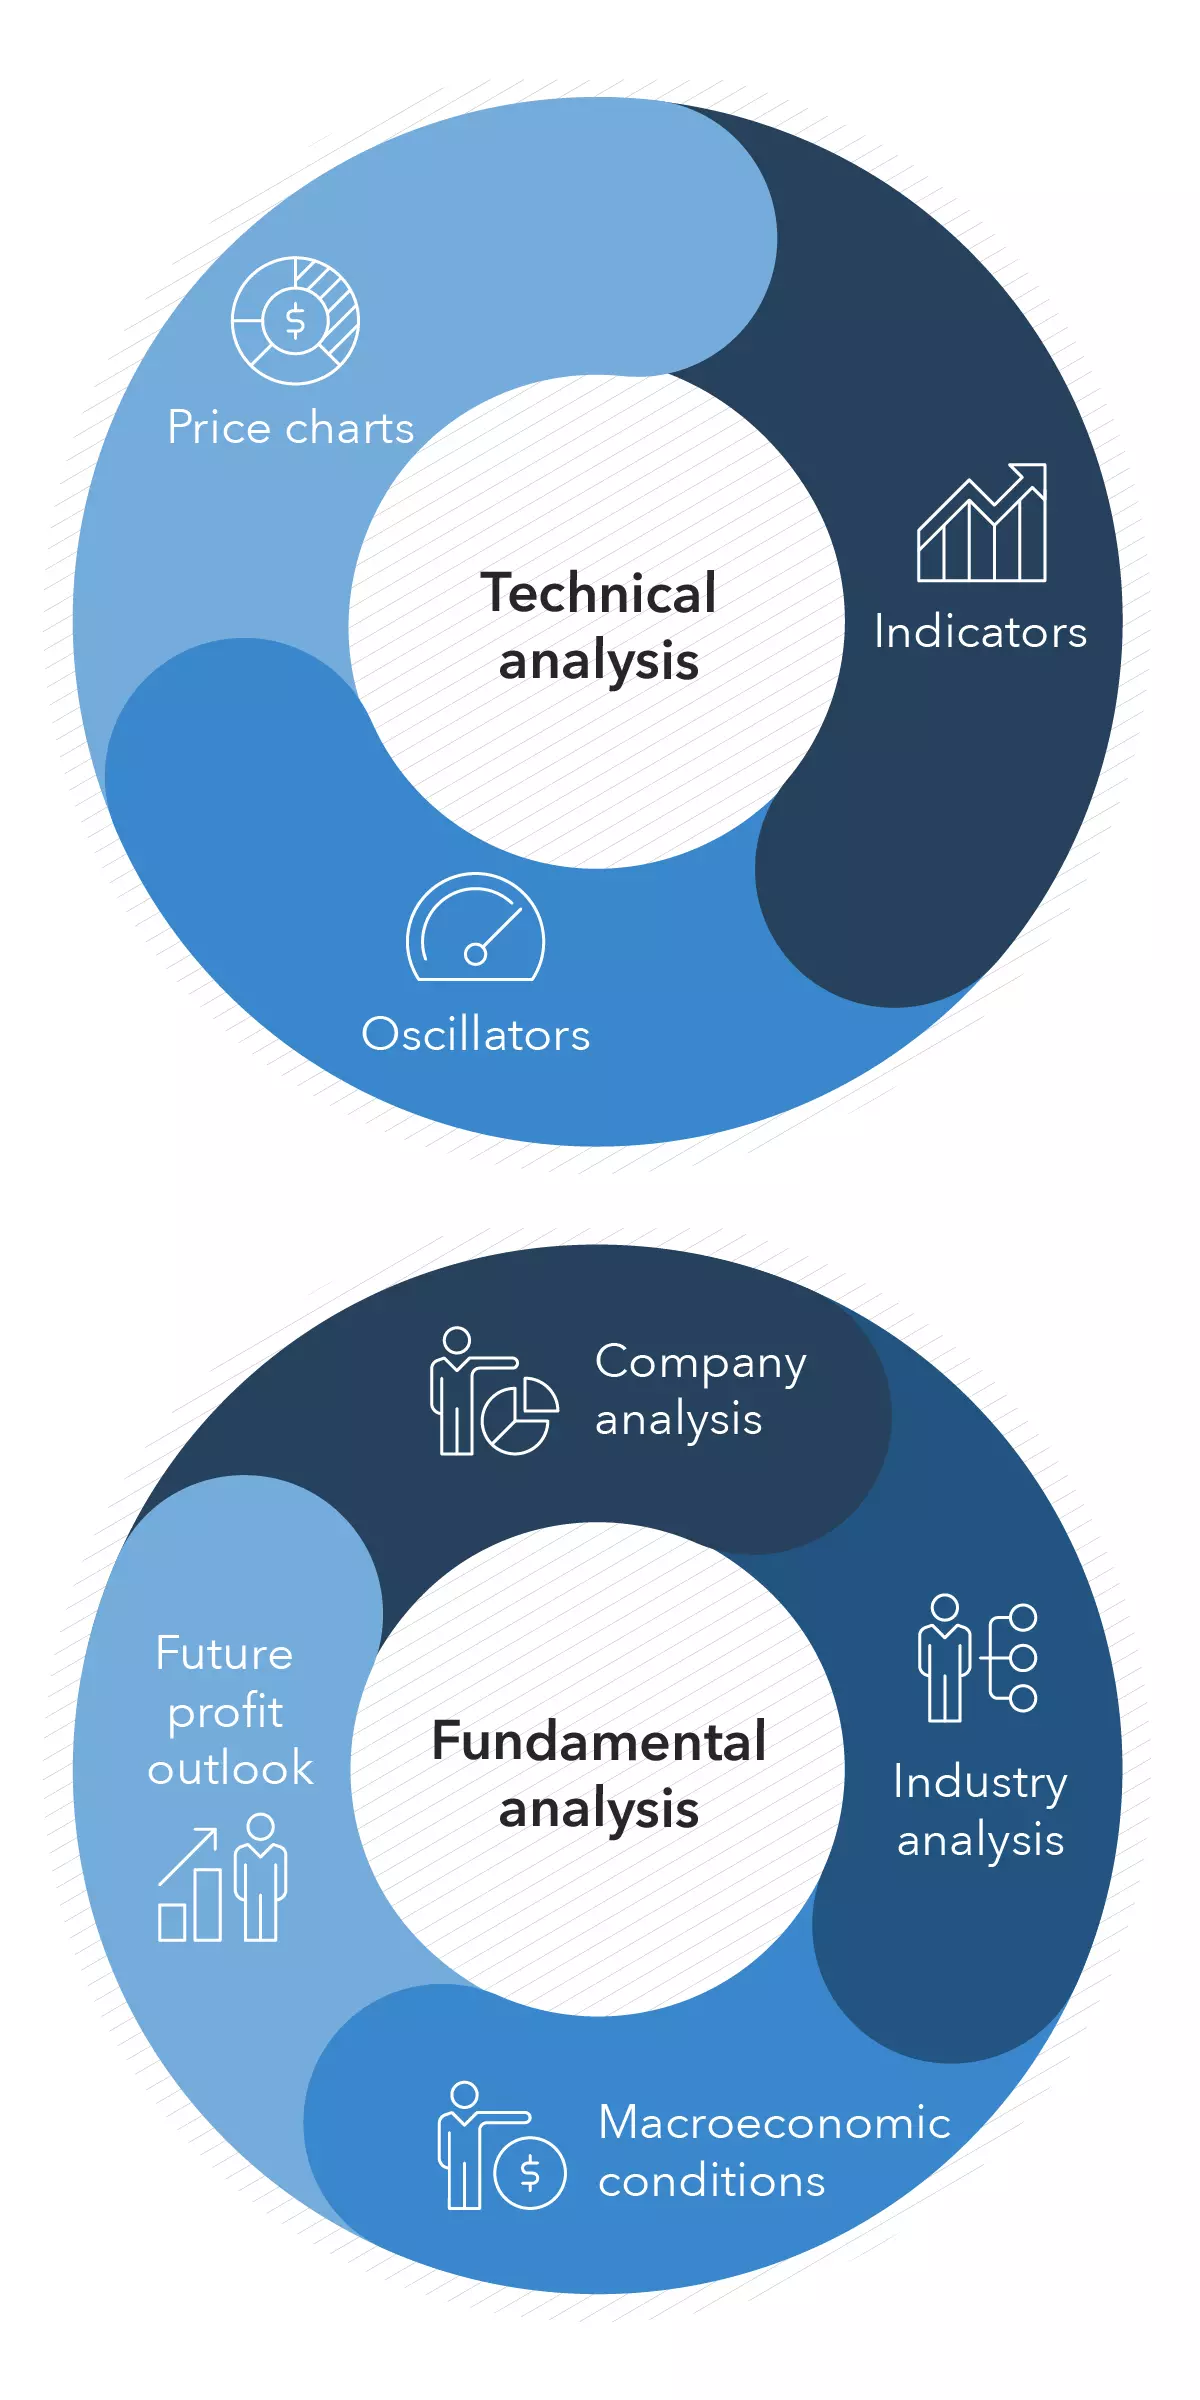
Technical analysis vs fundamental analysis
There is a vast range of differences between technical and fundamental analysis. Primarily though, instead of examining previous price movements, a trader using fundamental analysis will take various internal and external factors into account.
A fundamental analyst will use information to decide how much they think a particular asset is worth and assign it a ‘fair value’ – the value of an asset if all the information was priced into the market. If the current market price of the asset is below what they think it is worth, then they’ll buy. If it is over what they think it is worth, then they’ll sell.
.png/jcr:content/renditions/original-size.webp)
For example, let’s say a fundamental and a technical analyst were both considering trading Apple shares. A fundamental analyst might examine Apple’s recent earnings reports, how the technology sector is performing, and the health of the economy as a whole before deciding how much they think Apple shares are worth.
While a technical analyst would disregard all of that information and pay attention solely to Apple’s chart. They would use technical indicators to find patterns that would give an insight into where Apple shares have previously been, and use that data to guide assumptions about where the stock price is headed next. They would then trade accordingly.
At first, technical analysis might look a lot simpler than fundamental analysis. After all, you only have to examine a market’s chart instead of poring through news, economic reports and earnings releases. But a successful technical trader might utilise a huge range of indicators – and backtest their strategy to make sure that it’s fit for purpose – before they trade. So, it certainly isn’t the easier option.
Having said that, most traders won’t stick to pure technical or fundamental analysis – they’ll employ a mix of the two to ensure they have a fully balanced view. So, you could use fundamental analysis to pick the market you want to trade, and then use technical analysis to decide when you should open your position.
Limitations of technical analysis
Although technical analysis is widely used, the methodology does have its limitations. For example:
- Technical analysis can be subjective. Although indicators may show two traders the same signal, they could interpret the results in different ways
- It can create a self-fulfilling prophecy. If enough people trade using the same pattern, it will actually force the prediction to occur. While this can work in your favour, it can also make it more difficult to execute your trade if everyone is executing the exact same orders
- Technical analysis is not 100% accurate. There are always likely to be exceptions to the rule, which could be extremely dangerous. Unexpected movements can cause large price swings as technical traders rush to exit their positions
- It ignores the underlying fundamentals. By not looking at other factors that can move the market price, technical analysis provides a restricted view of the market. Although it can provide useful entry and exit points, assuming things go to plan, any sudden news announcements or company reports can cause volatility
It is important to be aware of any potential drawbacks of your strategy and take any steps to prevent them causing you unnecessary losses.
IGA, may distribute information/research produced by its respective foreign affiliates within the IG Group of companies pursuant to an arrangement under Regulation 32C of the Financial Advisers Regulations. Where the research is distributed in Singapore to a person who is not an Accredited Investor, Expert Investor or an Institutional Investor, IGA accepts legal responsibility for the contents of the report to such persons only to the extent required by law. Singapore recipients should contact IGA at 6390 5118 for matters arising from, or in connection with the information distributed.
The information/research herein is prepared by IG Asia Pte Ltd (IGA) and its foreign affiliated companies (collectively known as the IG Group) and is intended for general circulation only. It does not take into account the specific investment objectives, financial situation, or particular needs of any particular person. You should take into account your specific investment objectives, financial situation, and particular needs before making a commitment to trade, including seeking advice from an independent financial adviser regarding the suitability of the investment, under a separate engagement, as you deem fit.
Please see important Research Disclaimer.

Explore the markets with our free course
Discover the range of markets you can trade on - and learn how they work - with IG Academy's online course.
