Wall Street: producer prices outstrip forecasts, heightening inflation fears
January's PPI jump surpasses forecasts, stoking inflation concerns as markets anticipate key FOMC meeting minutes and a heavy week of economic reports and earnings.


With nerves barely settled after Tuesday's hotter-than-expected CPI scare, US equities ended the week in retreat after the Producer Price Index (PPI) increased by more than expected in January.
Headline PPI rose by 0.3% in January, the largest increase in five months, compared with forecasts of 0.1%. Core PPI, which excludes food and energy and has a strong feed through into core PCE, surged by 0.5%, well above market expectations of 0.1%. A core PCE print of 0.4% MoM in January (to be released on the 1st of March), which would see the three-month annualised inflation rate surge from 1.7% in December to 2.7%, now appears likely.
This week will see the Q4 earnings season continue with reports scheduled from companies including Walmart, Home Depot, Nvidia, Berkshire Hathaway, and Warner Bros. The key economic events on the calendar include the FOMC meeting minutes on Thursday morning, flash PMIs, and Fed speak from Bostic, Bowman, Harker, Cook, Kashkari, and Waller.
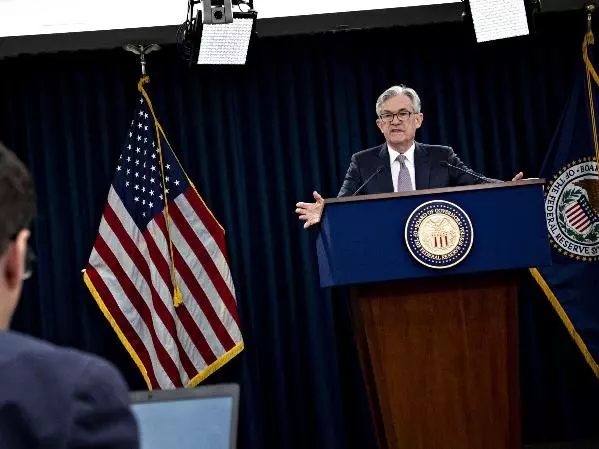
What is expected from FOMC meeting minutes (Thursday, 22 February at 6am)
The minutes from the FOMC's January meeting are scheduled to be released on Thursday, 22 February, at 6am.
At its meeting in January, the Fed maintained its target rate for the Fed Funds at 5.25%-5.50% for a fourth consecutive meeting. The Fed removed its out-of-date tightening bias and said rate cuts are coming, but not imminent.
“The Committee does not expect it will be appropriate to reduce the target range until it has gained greater confidence that inflation is moving sustainably toward 2 percent.”
The minutes will be closely scrutinised for the Fed's plans around its balance sheet, how it views the run of hotter-than-expected US data and risks to the global economy, and any clues about when the Fed expects to start cutting rates.
Fed funds rate chart

S&P 500 technical analysis
After catching the strong rally in the S&P 500 in the final months of 2023, we started the new year in a more cautious/neutral frame of mind.
Technically, the view remains that the S&P 500 is in the final stages (Wave V) of its rally from the October 2023 low, and we highlight again the bearish RSI divergence on the daily chart. Bearish RSI divergence occurs when prices make new highs, but the RSI fails to make a new high.
Furthermore, the S&P 500 cash last week stalled ahead of the trendline resistance currently at 5050, drawn from the December 1st 4100 high, viewed on the chart below. As such, we won’t be chasing the market at these levels and continue to expect a pullback to unfold in the coming weeks in the order of 5-7%.
S&P 500 daily chart

Nasdaq technical analysis
After catching the stunning rally in US equity markets in the final months of 2023, we started the new year more cautiously.
A loss of momentum type candle that formed last week provides some encouragement for our cautious view. However, the Nasdaq cash needs to see a sustained break of uptrend support at 17,600 and then horizontal support at 17450/30ish to confirm that a medium-term high is in place at 18,041 and that a deeper pullback towards 16,500/16250 is underway. Until then, the path of least resistance remains to the upside.
Nasdaq daily chart

- Source: TradingView. The figures stated are as of 19 February, 2024. Past performance is not a reliable indicator of future performance. This report does not contain and is not to be taken as containing any financial product advice or financial product recommendation.
This information has been prepared by IG, a trading name of IG Markets Limited. In addition to the disclaimer below, the material on this page does not contain a record of our trading prices, or an offer of, or solicitation for, a transaction in any financial instrument. IG accepts no responsibility for any use that may be made of these comments and for any consequences that result. No representation or warranty is given as to the accuracy or completeness of this information. Consequently any person acting on it does so entirely at their own risk. Any research provided does not have regard to the specific investment objectives, financial situation and needs of any specific person who may receive it. It has not been prepared in accordance with legal requirements designed to promote the independence of investment research and as such is considered to be a marketing communication. Although we are not specifically constrained from dealing ahead of our recommendations we do not seek to take advantage of them before they are provided to our clients.

Start trading forex today
Trade the largest and most volatile financial market in the world.
- Spreads start at just 0.6 points on EUR/USD
- Analyse market movements with our essential selection of charts
- Speculate from a range of platforms, including on mobile
Live prices on most popular markets
- Forex
- Shares
- Indices
