Soft start to the new quarter as RBA interest rate decision looms: Gold, AUD/USD, NZD/USD
Major US indices drifted higher on lighter volume to deliver a positive start to the new quarter, as we head into the Independence Day holiday.


Market Recap
Major US indices drifted higher on lighter volume to deliver a positive start to the new quarter, as we head into the Independence Day holiday. Overnight, the US Institute for Supply Management (ISM) manufacturing Purchasing Managers' Index (PMI) data has been mixed with a slight underperformance (46 versus 47 consensus). Some reasons to cheer may be the significant progress in pricing pressures for US manufacturers (41.8 versus 44.0 consensus) and some cooling of employment (48.1 versus 50.8 consensus), but new orders remained in contractionary territory for the 10 straight months as a reflection of some downside risks to growth ahead.
Along with stronger-than-expected US construction spending, expectations remained firm that the Fed will deliver its last 25 basis-point (bp) hike later this month to conclude its hiking cycle. US Treasury yields closed higher despite an initial dip, while the US dollar continues to show some signs of exhaustion with a subdued close.
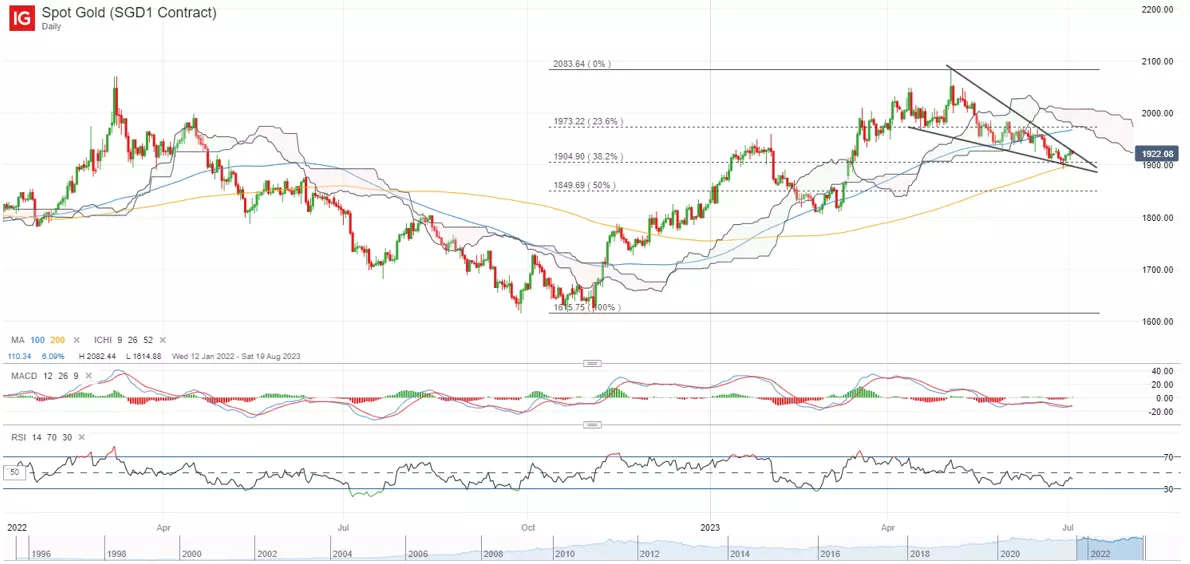
Gold prices have been trading on a descending wedge pattern thus far, with a move below its support confluence at the US$1,940 in mid-June this year suggesting sellers taking control and leaves the near-term trend tilted to the downside. CFTC data has revealed further unwinding of net-long positioning from money managers last week. Thus far, the RSI on the daily chart has also struggled to reclaim its 50 level. Immediate support at the US$1,900 level will be crucial to hold next, with some dip-buying seen last week with the formation of a bullish pin bar. Failure for the US$1,900 level to hold could potentially pave the way to retest the US$1,850 level next.
Asia Open
Asian stocks look set for a mixed open, with Nikkei -1.06%, ASX +0.12% and KOSPI -0.11% at the time of writing. An upside surprise in China’s Caixin manufacturing PMI has paved the way for some gains in Chinese equities yesterday, with the Nasdaq Golden Dragon China Index up 2.1%, following a similar gain in the Hang Seng Index in the earlier session. The recent tit-for-tat move from China to restrict export of chip-making metals to US could take some focus, which may affect longer-term production rather than near-term impact. While it raises the prospects for more tit-for-tat escalation between US and China, tensions may still seem measured for now, as both economies countries are still trying to cope with their respective economic issues (US inflation, China’s growth).
The day ahead will bring focus to the Reserve Bank of Australia’s (RBA) interest rate decision. While the recent 13-month low in Australia’s May inflation data has anchored views of a potential rate pause at the upcoming meeting, markets are still pricing for any upcoming pause to be a temporary move as compared to the end of tightening. That will leave the policymakers’ guidance on close watch. Any acknowledgement of the recent downside surprise in inflation could raise hopes for a prolonged rate pause, but on the other hand, keeping its firm stance for additional tightening ahead could be seen as hawkish and provide an uplift for the AUD.
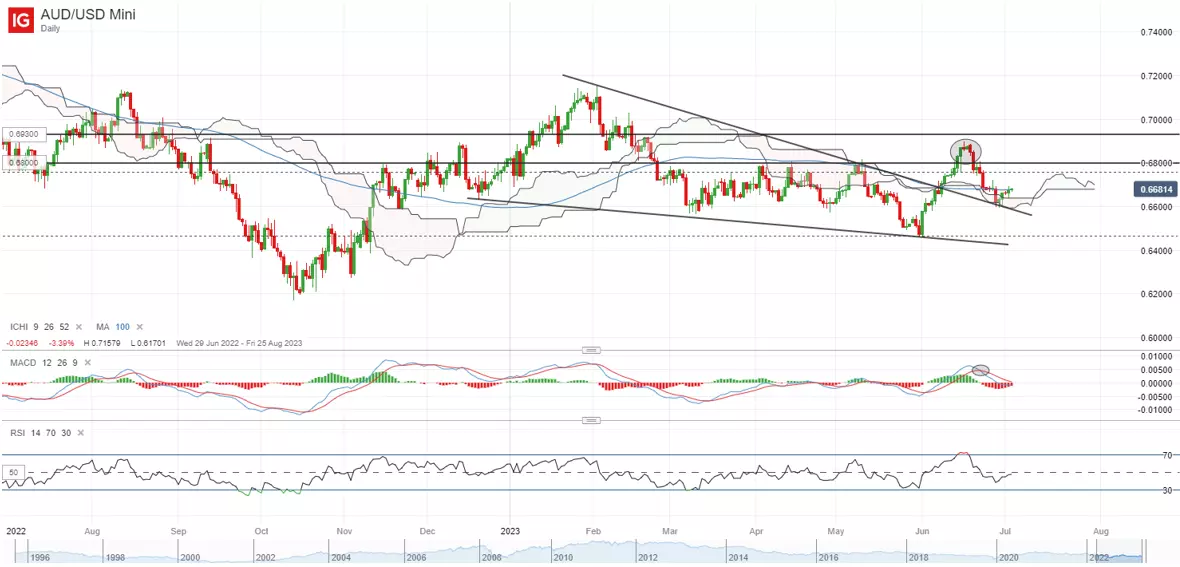
The AUD/USD is attempting to bounce off a previous resistance-turned-support trendline but much awaits for buyers, with the RSI still hanging below the 50 level while its 100-day MA serves as immediate resistance to overcome. Failure to hold the trendline support over the coming days at the 0.658 level could pave the way to retest its year-to-date low at the 0.646 level. On the upside, any reclaim of its 100-day MA will leave the key 0.680 level on watch.
On the watchlist: NZD/USD trading on descending channel pattern
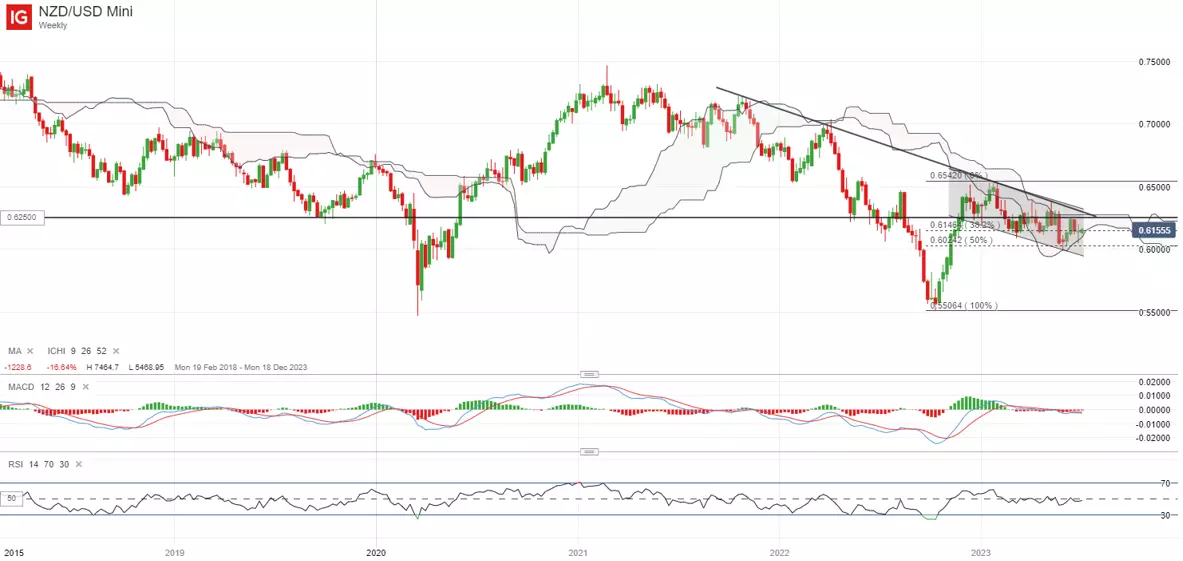
Since the start of the year, the NZD/USD has been kept firmly within a descending channel pattern on the weekly chart, with the weekly RSI struggling to cross above the key 50 level as a reflection of sellers in control. The series of lower highs over the past year, along with a failure to move above its Ichimoku cloud resistance (weekly) on past three interactions, has kept a downward trend in place for now.
With New Zealand’s economy falling in a technical recession ahead of the US, the pressure for rate cuts may be mounting for the Reserve Bank of New Zealand (RBNZ) versus the US Fed, where pockets of economic resilience are still presented in the US. The US economic surprise index currently hangs at its three-month high.
Immediate resistance for buyers may be at the 0.625 level, where a resistance confluence stands (Ichimoku cloud, upper channel trendline, downward trendline resistance). Any reclaim of the 0.625 level could pave the way to retest the 0.654 level next. Until that occurs, the current downward bias remain, which could leave the lower channel support on watch at the 0.600 level.
Monday: DJIA +0.03%; S&P 500 +0.12%; Nasdaq +0.21%, DAX -0.41%, FTSE -0.06%
This information has been prepared by IG, a trading name of IG Markets Limited. In addition to the disclaimer below, the material on this page does not contain a record of our trading prices, or an offer of, or solicitation for, a transaction in any financial instrument. IG accepts no responsibility for any use that may be made of these comments and for any consequences that result. No representation or warranty is given as to the accuracy or completeness of this information. Consequently any person acting on it does so entirely at their own risk. Any research provided does not have regard to the specific investment objectives, financial situation and needs of any specific person who may receive it. It has not been prepared in accordance with legal requirements designed to promote the independence of investment research and as such is considered to be a marketing communication. Although we are not specifically constrained from dealing ahead of our recommendations we do not seek to take advantage of them before they are provided to our clients.

Seize a share opportunity today
Go long or short on thousands of international stocks.
- Increase your market exposure with leverage
- Get spreads from just 0.1% on major global shares
- Trade CFDs straight into order books with direct market access
Live prices on most popular markets
- Forex
- Shares
- Indices
