Disney’s share price: what to expect from Q4 results
Find out what to expect from Disney’s earnings results, how they will affect Disney share price, and how to trade Disney’s earnings.


When is Disney’s results date?
It’s felt like a long wait since competitor Netflix’s earnings results last month, but we’ll get fourth quarter (Q4) figures from the more diversified media conglomerate this coming Wednesday, February 9, after the market close.
Disney share price: forecasts from Q4 results
And investors will be hoping that it isn’t just a gap in its timing release, but also that it won’t share the same fate as the streaming company whose Q4 results beat on earnings but flashed warning signs on upcoming Q1 subscriber growth, citing “added competition” that could impact additional growth. Disney+ is seen as the leader in that category of added competition, and just as the plummet in Netflix’s price dragged its streaming rivals down with it (though by a smaller percentage), investors in the sphere will be noting how Disney fares on that front and whether it’ll avoid mirroring the story of slow growth on the streaming front.
It doesn’t help that it missed last time around on both earnings (37 cents vs. estimates of 51 cents) and revenue ($18.53 billion vs. $18.79 billion expectations), subscriber growth of just 2.1 million for a total of 118.1 million. And its chief executive officer (CEO) then expected “low single-digit millions” when it came to Q4 streaming subscriptions. The theme following Netflix’s earnings has seemingly highlighted the end to that Covid-19 pandemic push.
But where those whose business relies solely on streaming might not enjoy significant growth in a phase of reopening, it’s here where the conglomerate’s more diversified offering might shine, even if Covid-19 Omicron is expected to impact it somewhat in the past quarter.
Putting it all together, and expectations are for a higher earnings per share figure of $0.61 (after being revised lower over the past quarter), and for revenue averaging $18.74 billion (source: finance.yahoo.com). When it comes to analysts’ ratings, the number of holds has increased threefold, with downgrades since taking some into underperform and sell territory, the latter absent a few months ago amongst the majors. Overall, it’s no longer a majority advocating either a buy or strong buy, for a more mixed outlook instead (finance.yahoo.com).
Trading Disney’s Q4 results: Disney weekly chart with key technical indicators, technical overview and trading strategies
The overview a few months ago on the weekly time frame was consolidatory but with negative technical bias, and since then the picture hasn’t gotten any rosier. The prices have managed to partially recover off of the lower end of its weekly Bollinger Band, thus far beneath nearly all of its main moving averages (MAs) in this longer-term time frame, oscillating within its weekly bear trend channel, an ADX (Average Directional Movement Index) reading in trending territory, its negative Directional Movement (DI-) holding a healthy margin over its positive Directional Movement (DI+), and a relative strength index (RSI) figure above but not far off oversold territory as seen in the chart below.
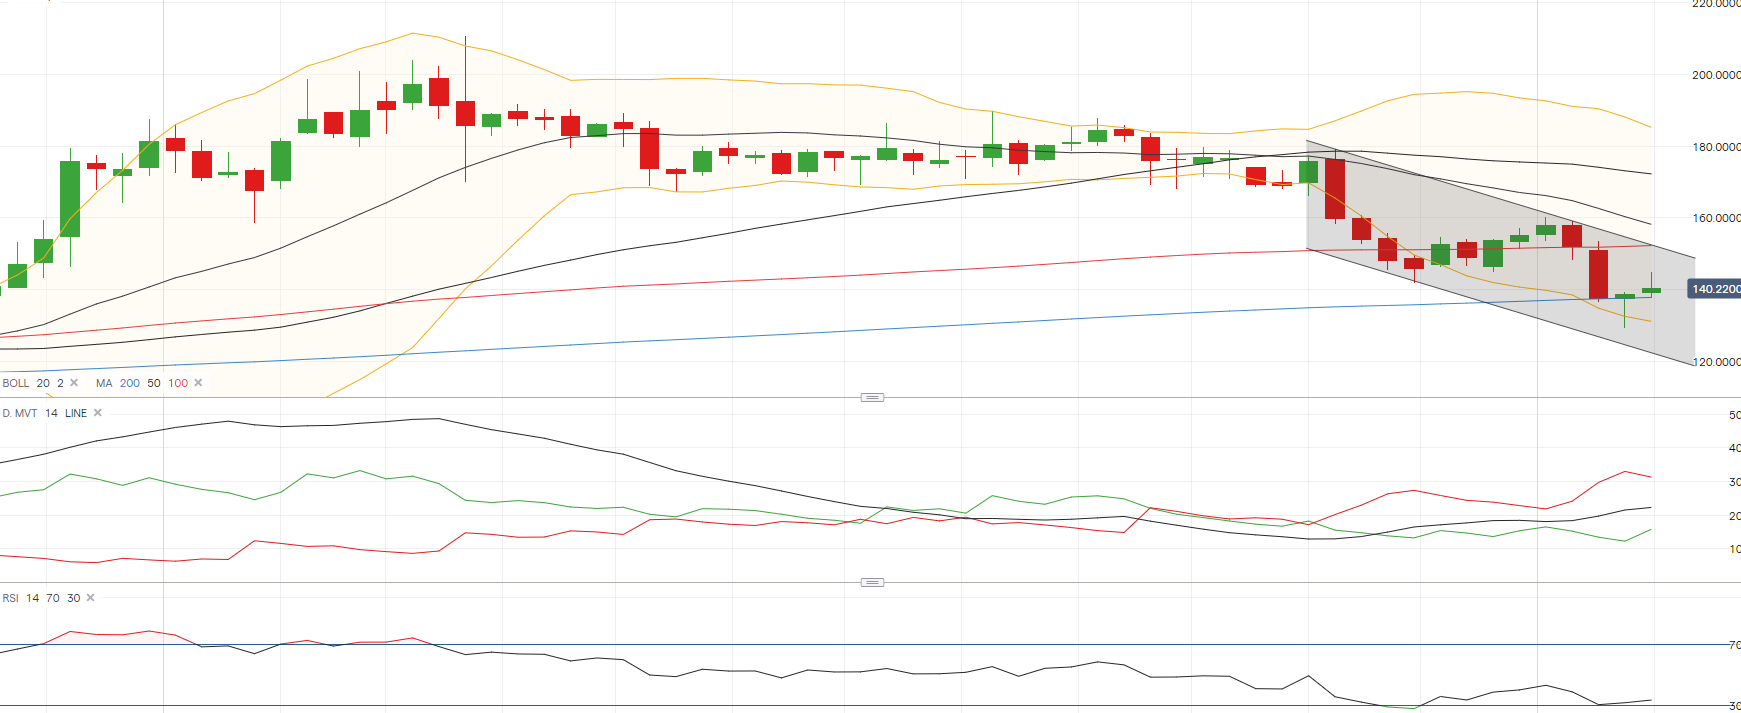
A technical overview that’s usually classified as a stalling bear trend, in the sense that most weeks haven’t offered sell-breakout strategies much momentum beyond key support levels, with intraweek movement mostly limiting save for the week of the 8 November and the 17th of last month. And while that usually translates into conformist sell-breakouts and contrarian buy-breakout strategies getting tested absent volatility with reversals enjoying better performance, let’s not forget that fundamental updates like Wednesday’s earnings have a tendency to fall into the volatile category.
As a reminder, technicals hold less relevance in the face of significant events and a company’s earnings definitely falls within the scope of major fundamentals influencing its share price.
| Current technical overview | Bear Trend - Stalling |
| Technical overview conformist strategies | Sell 1st resistance after reversal, sell 1st support upon breakout from above |
| Technical overview contrarian strategies | Buy 1st support at/before price, buy 1st resistance upon breakout from below |
| S/L for 2nd resistance | 157.98 |
| 2nd Resistance | 154.98 |
| S/L for 1st resistance | 151.97 |
| 1st Resistance | 148.97 |
| Relative starting point | 142.97 |
| 1st Support | 136.97 |
| S/L for 1st support | 133.97 |
| 2nd Support | 130.96 |
| S/L for 2nd support | 127.96 |
IG Client sentiment* and short interest for Disney shares
For traders and investors alike, the past quarter’s share price decline has been a real test, extreme buy bias held amongst retail traders little changed since we did the Q3 earnings preview released last November, down a notch at 98% from what was a near full majority long bias.
Short interest has dropped since, as it was above 24 million in the previous commentary a few months back, while the latest (out of shortsqueeze.com) shows a drop to over 20 million, though in the grand scheme of things is still slightly above 1% of the total.
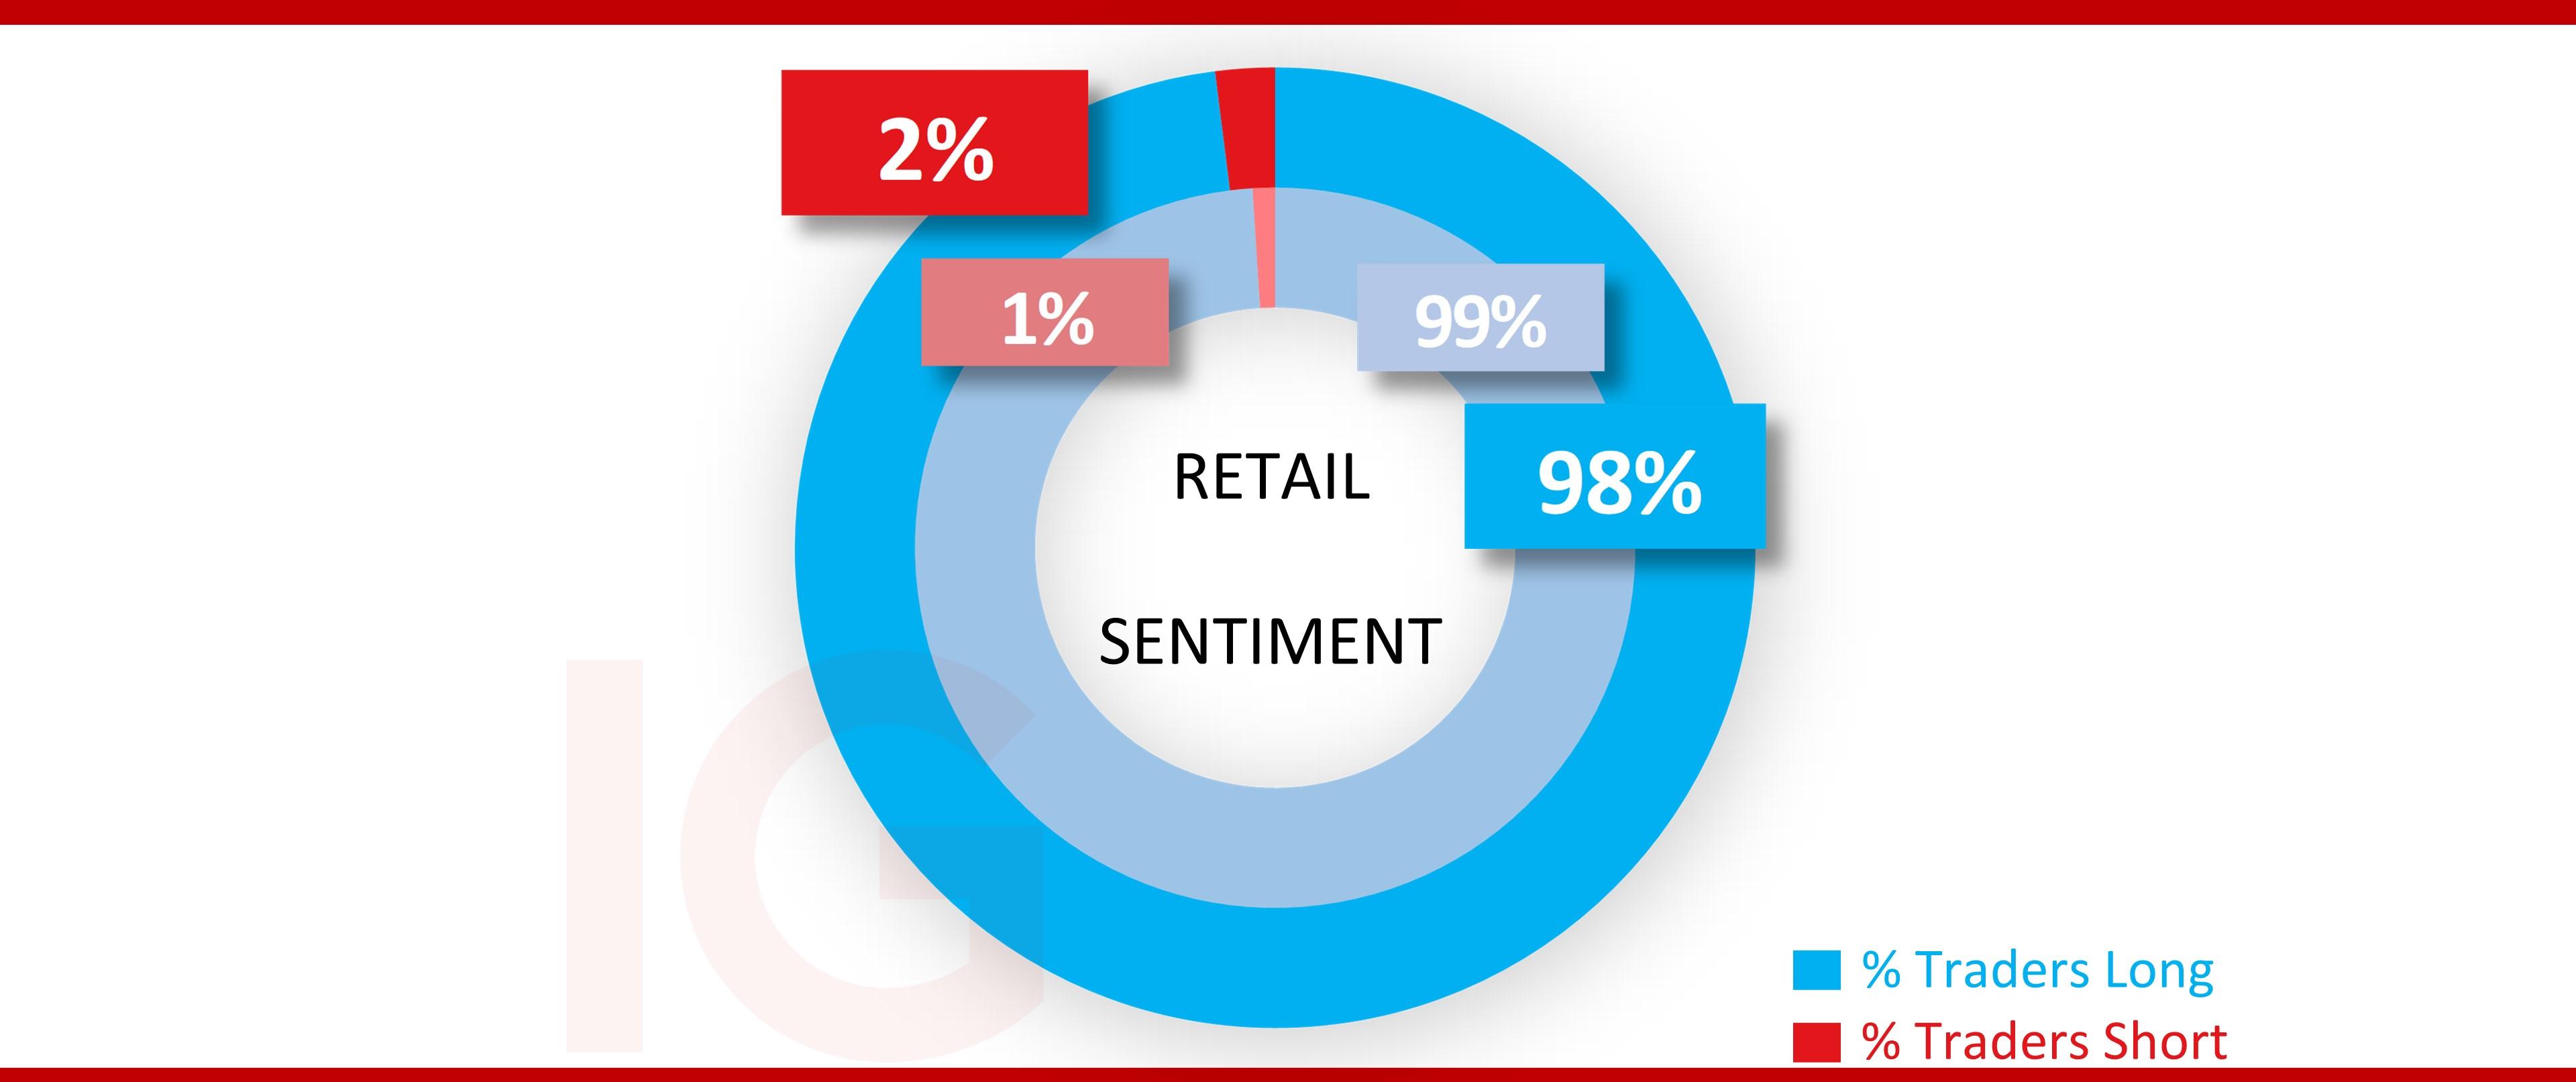
* The percentage of IG client accounts with positions in this market that are currently long or short. Calculated to the nearest 1%, as of the start of the week for the outer circle. Inner circle is from the previous earnings preview on Friday, November 5, 2021.
This information has been prepared by IG, a trading name of IG Markets Limited. In addition to the disclaimer below, the material on this page does not contain a record of our trading prices, or an offer of, or solicitation for, a transaction in any financial instrument. IG accepts no responsibility for any use that may be made of these comments and for any consequences that result. No representation or warranty is given as to the accuracy or completeness of this information. Consequently any person acting on it does so entirely at their own risk. Any research provided does not have regard to the specific investment objectives, financial situation and needs of any specific person who may receive it. It has not been prepared in accordance with legal requirements designed to promote the independence of investment research and as such is considered to be a marketing communication. Although we are not specifically constrained from dealing ahead of our recommendations we do not seek to take advantage of them before they are provided to our clients.

Seize a share opportunity today
Go long or short on thousands of international stocks.
- Increase your market exposure with leverage
- Get spreads from just 0.1% on major global shares
- Trade CFDs straight into order books with direct market access
Live prices on most popular markets
- Forex
- Shares
- Indices
