A trader’s guide to the stochastic oscillator
The stochastic oscillator is a technical indicator that enables traders to identify the end of one trend and the beginning of another. Discover what the stochastic oscillator is and how to use it to predict market turning points.


What is the stochastic oscillator?
The stochastic oscillator is a momentum indicator, which compares the most recent closing price relative to the previous trading range over a certain period of time. Unlike other oscillators, it does not follow price or volume, but the speed and momentum of the market.
The stochastic oscillator was developed by George C Lane in the late 1950s. His theory was based on the idea that market momentum will change direction much faster than volume or price increases. Therefore, the stochastic oscillator is considered a leading indicator, which means it can be used to predict price movements and inform traders’ decisions.
How to calculate the stochastic oscillator
The stochastic oscillator is formed of two lines on a price chart: the indicator line (%K) and a signal line (%D).
To calculate the signal line, a trader will need to subtract the lowest price over the period from the most recent closing price. They will then divide this by the highest price over the period minus the lowest price. The formula for the stochastic oscillator is as follows:
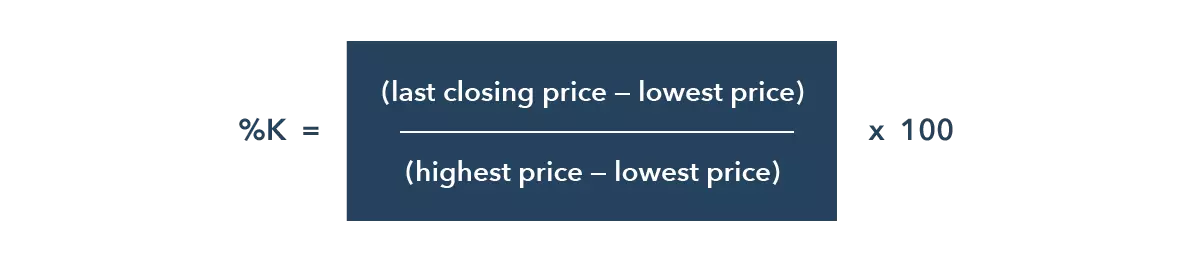
The stochastic oscillator line is normally plotted over a period of 14 days, while the signal line is a three-day simple moving average (SMA) of the %K.
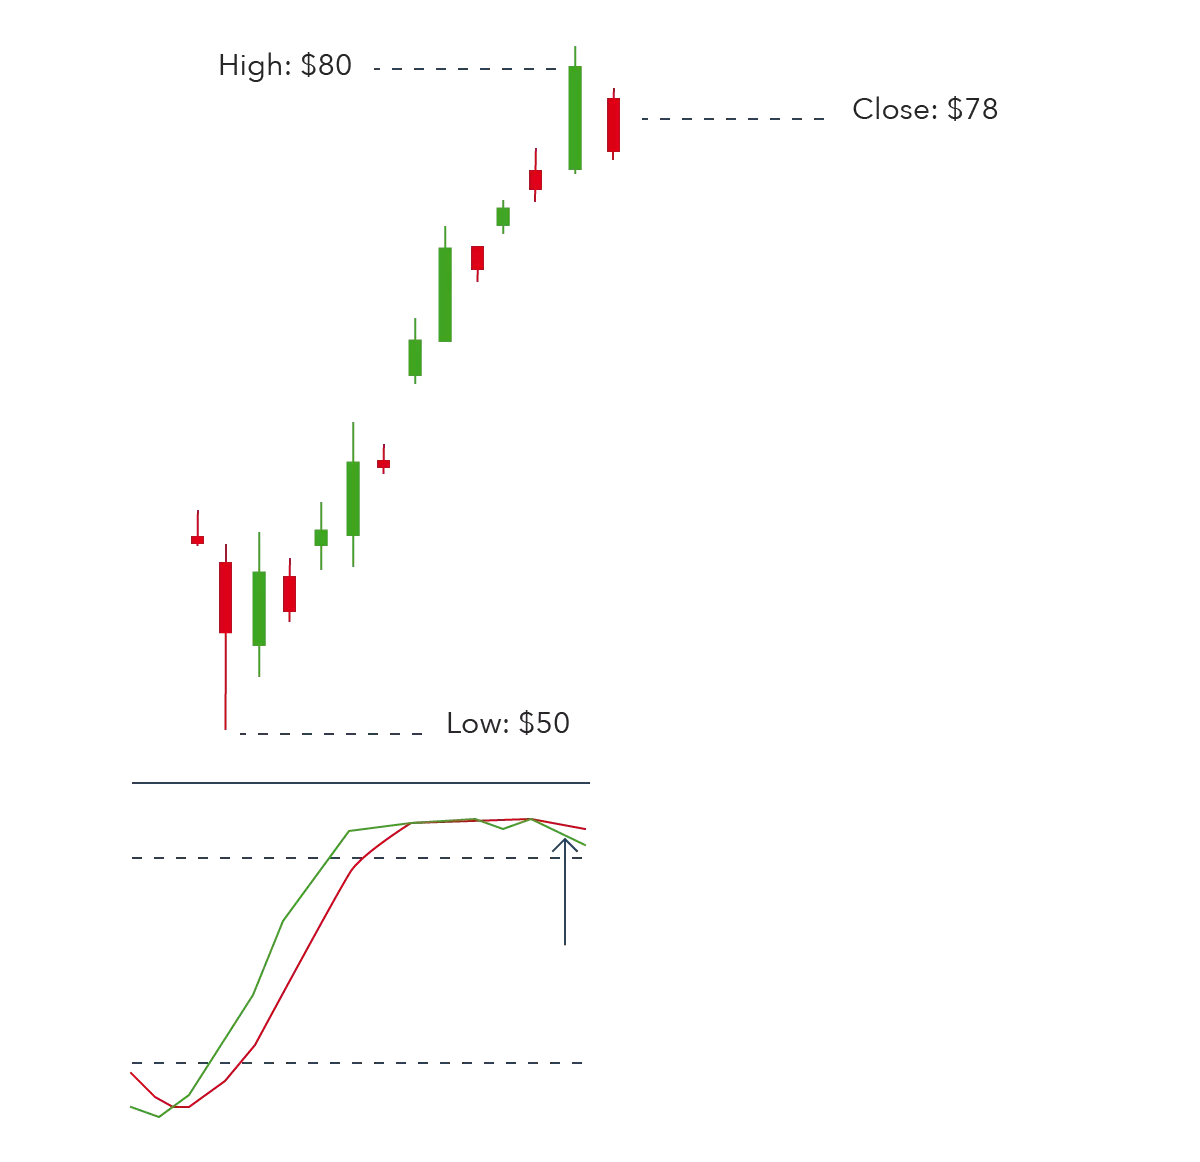
Now, let’s look at an example of company XYZ’s share price. From the chart below, we can see that the 14-period low was $50, while the high was $80. XYZ’s stock closed very near the period high, at $78. So, the stochastic oscillator line would be calculated as follows: [(78-50)/(80-50) x 100] = 93.3%
This figure indicates that the closing price was extremely near the top of the asset’s 14-period trading range – we’ll go onto what this means in a moment.
How to use the stochastic oscillator in trading
To use the stochastic oscillator, it is first important to understand exactly what the readings are showing you.
The stochastic oscillator is a bound oscillator, which means it operates on a scale of zero to 100 – this scale represents an asset’s entire trading range during the 14 days, and the final percentage shows where the most recent closing price sits within the range. This makes it easy to identify overbought and oversold signals. Regardless of how quickly the market price changes, or how the market volume fluctuates, the stochastic oscillator will always move in this range.
If there is a reading over 80, the market would be considered overbought, while a reading under 20 would be considered oversold conditions.
If we continue our previous example, a reading of 93.3% would be considered extremely overbought during the 14-day period. Following stochastic oscillator theory, this implies that a price reversal would be impending. In fact, some people believe that a reading above 90 is extremely risky and warrants the closing of positions.
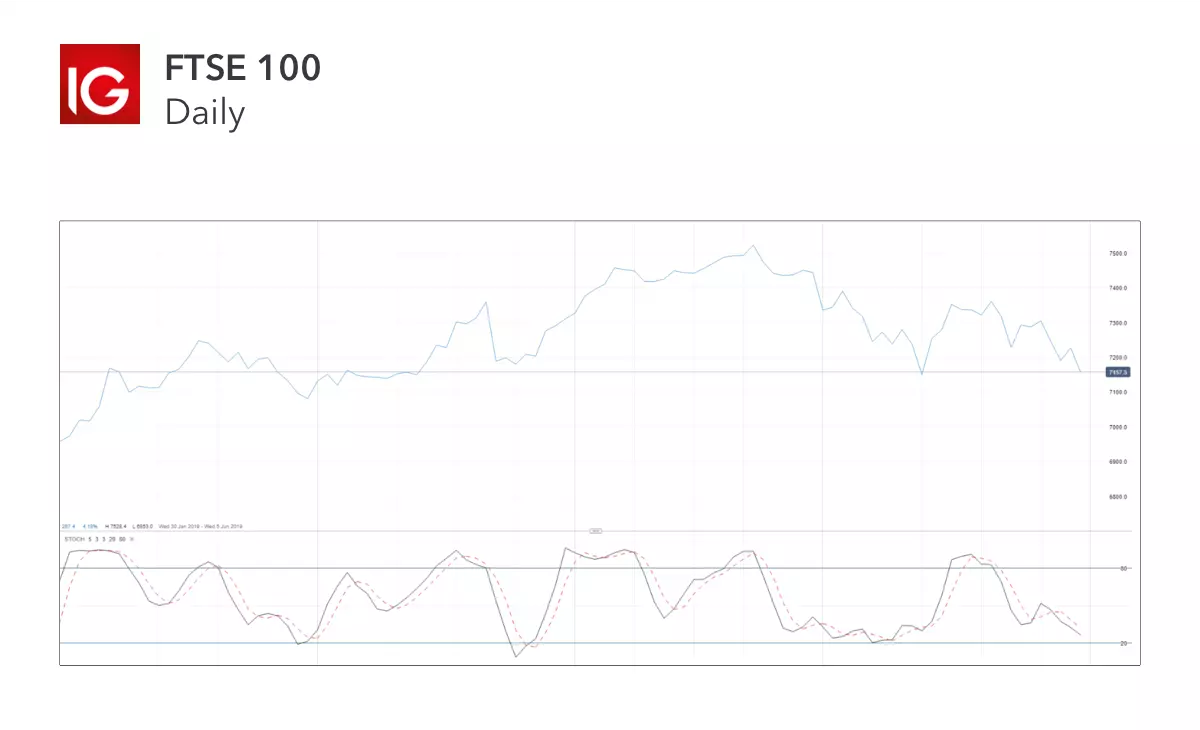
As we have seen, the stochastic oscillator is shown as two lines on the chart, the %K (the black line on the chart below) and the %D (the red dotted line below). When these two lines cross, it is a sign that a change in market direction is approaching. If %K rises above %D, it would be a buying signal – unless the values are above 80. And if %K falls lower than %D, then it’s seen as a selling signal – unless the values are below 20.
Bullish and bearish divergences
The most common use of the stochastic oscillator is to identify bullish and bearish divergences – points at which the oscillator and market price show different signals – as these are normally indications that a reversal is imminent. A bullish divergence occurs when the price records a lower low, but the stochastic oscillator forms a higher low. This shows that there is less downward momentum and could indicate a bullish reversal. A bearish divergence forms when the market price reaches higher highs, but the stochastic oscillator forms a lower high – this indicates declining upward momentum and a bearish reversal.
However, it is always important to remember that overbought and oversold readings are not completely accurate indications of a reversal. The stochastic oscillator might show that the market is overbought, but the asset could remain in a strong uptrend if there is sustained buying pressure. This is often seen during market bubbles – periods of increased speculation that cause an asset’s price to reach consistently higher highs.
This is why it’s vital for anyone using the stochastic oscillator to combine the readings with other technical analysis indicators and a comprehensive risk management strategy.
Bull and bear set-ups
The founder of the stochastic oscillator, George Lane, believed that divergence could also be used to predict bottoms or tops. He called this a bull or bear set-up, as the indicator would reach a top or bottom which preceded the market changing direction.
A bull set-up is the opposite of a bullish divergence. It occurs when the market price forms a lower high, but the stochastic oscillator reaches a higher high. Even though the asset itself did not reach a new high, the optimism from the indicator is a sign that the upward momentum is strengthening.
A bear set-up is the inverse of a bearish divergence. It happens when the market price forms a higher low, but the stochastic oscillator falls to a lower low. Even though the asset held its price, the indicator shows there is increasing downward momentum.
Stochastic oscillator vs relative strength index
The stochastic oscillator and relative strength index (RSI) are both momentum oscillators, which are used to generate overbought and oversold signals.
Despite both being used for similar purposes, to identify price trends, they are based on very different theories. The stochastic oscillator is based on the idea that that closing prices will remain near historical closing prices, while the RSI tracks the speed of the trend.
Both oscillators work on a zero to 100 scale, but their signals also vary. The RSI would indicate the market is overbought if it reaches above 70, while the stochastic oscillator would need to reach 80. And the RSI would consider the underlying asset undersold if the indicator was below 30, while the stochastic oscillator would need to fall to 20.
Stochastic oscillator summed up
How you choose to use the stochastic oscillator will depend on your personal preferences, trading style and what you hope to achieve. However, there are a few key points that everyone who uses this momentum indicator should know:
- The stochastic oscillator is a momentum indicator, which compares the most recent closing price relative to the previous trading range over a certain period
- It is a leading indicator, as it’s based on the idea that market momentum will change direction must faster than volume or price increases
- The stochastic oscillator is formed of two lines on a price chart: the indicator itself (%K) and a signal line (%D)
- The stochastic oscillator is a bound oscillator, which means it operates on a scale of zero to 100. A reading over 80 is an indication the market is overbought, while a reading under 20 shows oversold conditions
- The most common use of the stochastic oscillator is to identify bullish and bearish divergences – points at which the oscillator and market price show different signals
- It can also be used to identify bull and bear set-ups, points that indicate increasing momentum in the opposite direction
- It is often likened to the relative strength index (RSI), another momentum indicator. However, the RSI is based on the speed of changing prices, rather than historical prices
This information has been prepared by IG, a trading name of IG Limited. In addition to the disclaimer below, the material on this page does not contain a record of our trading prices, or an offer of, or solicitation for, a transaction in any financial instrument. IG accepts no responsibility for any use that may be made of these comments and for any consequences that result. No representation or warranty is given as to the accuracy or completeness of this information. Consequently any person acting on it does so entirely at their own risk. Any research provided does not have regard to the specific investment objectives, financial situation and needs of any specific person who may receive it. It has not been prepared in accordance with legal requirements designed to promote the independence of investment research and as such is considered to be a marketing communication. Although we are not specifically constrained from dealing ahead of our recommendations we do not seek to take advantage of them before they are provided to our clients.
CFDs are a leveraged products. CFD trading may not be suitable for everyone and can result in losses that exceed your initial deposit, so please ensure that you fully understand the risks involved.

Discover how to trade the markets
Explore the range of markets you can trade – and learn how they work – with IG Academy's free ’introducing the financial markets’ course.
