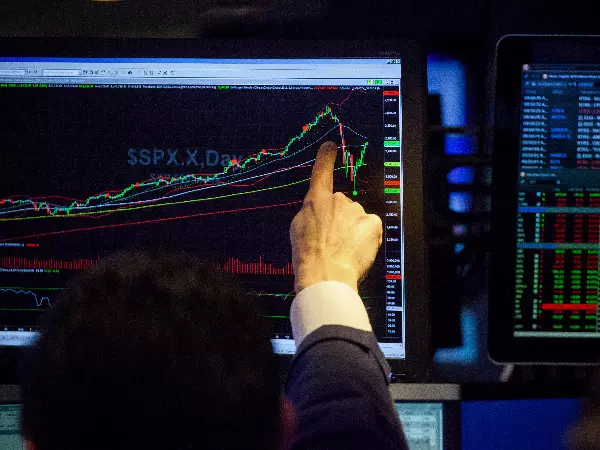
Swing trading strategies: a beginner’s guide
There are a variety of swing trading techniques and strategies that traders can use to get the best results from this short-term trading style. Discover what swing trading is and three popular swing trading indicators.

What is swing trading?
Swing trading is a trading style that focuses on trying to capture a portion of a larger move. Swing traders will focus on taking smaller, but more frequent gains, and cutting losses as quickly as possible.
This style of trading is based on the assumption that market prices rarely move in a straight line, and that traders can find opportunity in the minor oscillations. Swing traders focus on the points where a market changes direction, entering and exiting their trades at these ‘swings’. Swing trading is about trading short-term legs of longer-term trends.
Swing trading basics: how swing trading works
Swing trading involves identifying profitable times to enter trades based on two different types of swing: ‘swing lows’ and ‘swing highs’. A swing low is a term used to refer to a major price low, while a swing high is a term used to highlight a major price high.
.png/jcr:content/renditions/original-size.webp)
A swing trader is concerned with trying to capture the price movements between these major lows and highs. In an uptrend, a trader would be looking to buy, or 'go long', from these lows and close the trade at the swing highs. In a downtrend, traders would be looking to sell, or 'go short', from the highs to the lows.
It is impossible to consistently pinpoint the exact high and low of every swing move, but the idea is to capture as much of the price movement as possible. In fact, it’s common to miss the exact highs and lows, as it can take time to confirm that a new swing is underway.
Swing trading vs day trading: what’s the difference?
The difference between day trading and swing trading is the amount of time you hold the position. The day trading style, as it says on the tin, means closing positions before the end of each trading day. Day traders will buy and sell multiple assets within the trading day to take advantage of small market movements.
But swing traders don’t necessarily have this restriction as the duration of a swing trade is relative to the timeframe of the trend, which can vary significantly. So, while the trade duration could be as short as 30 minutes, or even less, it could also last for longer than a day.
Two popular swing trading strategies
We’ve summarised two popular swing trading strategies that are used to create a methodology for entering and exiting a market. These are:
Trend trading
A trend trading strategy relies on using technical indicators to identify the direction of market momentum. Swing trading strategies will look to capture a portion of this trend, taking advantage of the swing high or low.
Trend traders will take a long position if they believe the market is going to reach higher highs, and a short position if they think the market will reach lower lows. They would then exit the trade when analysis indicated a reversal was imminent.
Some of the most popular technical analysis tools used in trend-following strategies include moving averages, the relative strength index (RSI) and the average directional index (ADX).
Breakout trading
Breakout trading is the strategy of taking a position as early as possible within a given trend, in order to capitalise on the market movement. Swing traders will look to identify points at which the market is about to ‘break out’ from the range in which it has been trading – typically when a support or resistance line is broken.
Breakout trading requires the trader to know how strong or weak the market momentum is, which is usually calculated using the volume of trades that are taking place. This is why volume-weighted moving averages are a popular technical analysis tool among swing traders.
Popular swing trading indicators
In order to create a swing trading strategy, many traders will use price charts and technical indicators to identify potential swings in a market, and profitable entry and exit points. Popular swing trading indicators include:
Moving averages
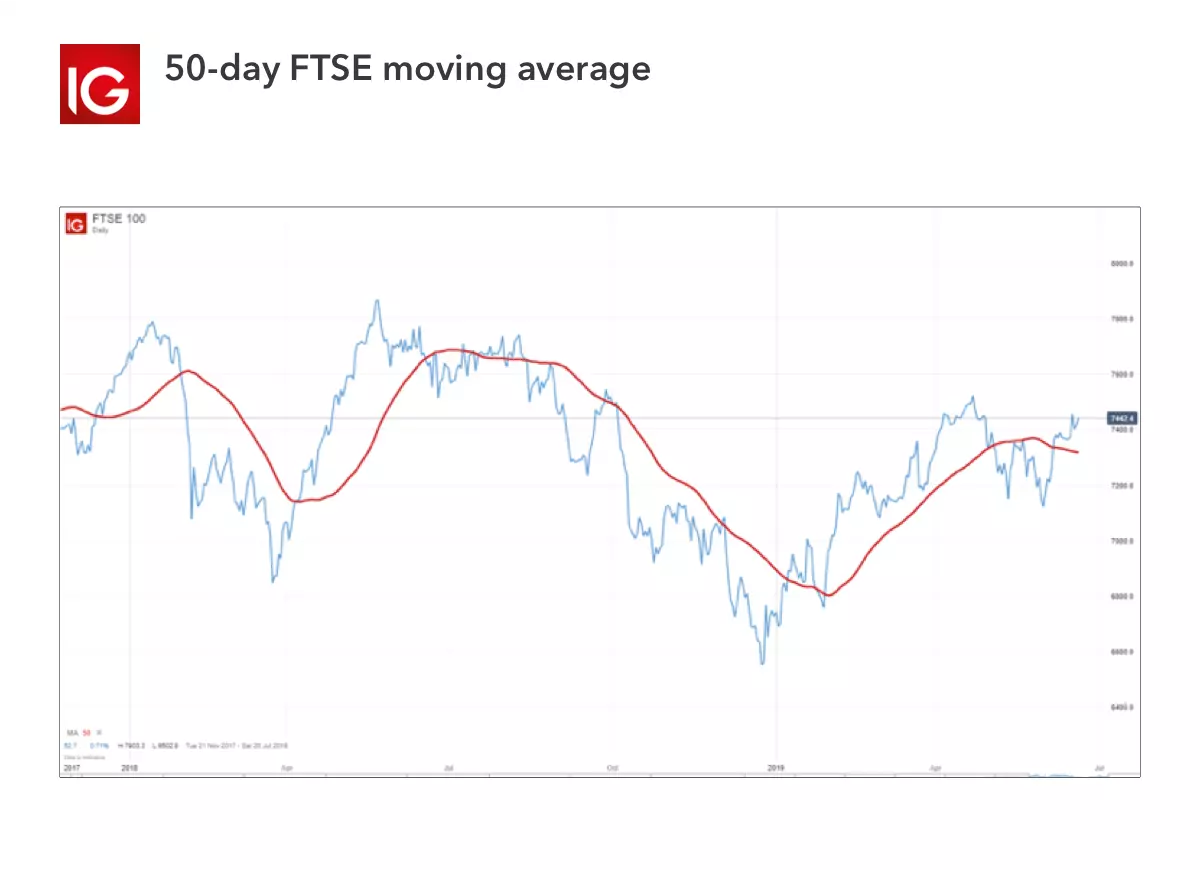
One of the most popular indicators to use is the moving average (MA). This indicator looks at the closing price data over a period of time, to ascertain the average value of the asset. For example, using a 50-day MA would take the closing price for each of the last 50 days, add them up, and divide them by 50 to get the average price. These points are then plotted together to create a single line, smoothing out the market movements, so that a trader can better understand the overall trend.
The MA is focused on identifying or confirming a trend, rather than predicting it – this is because the MA is a lagging indicator, so it will always be slightly behind the market price. In principle, when the price is trading firmly above the moving average the trend is considered to be up and when the price is trading below the moving average the trend is considered to be down.
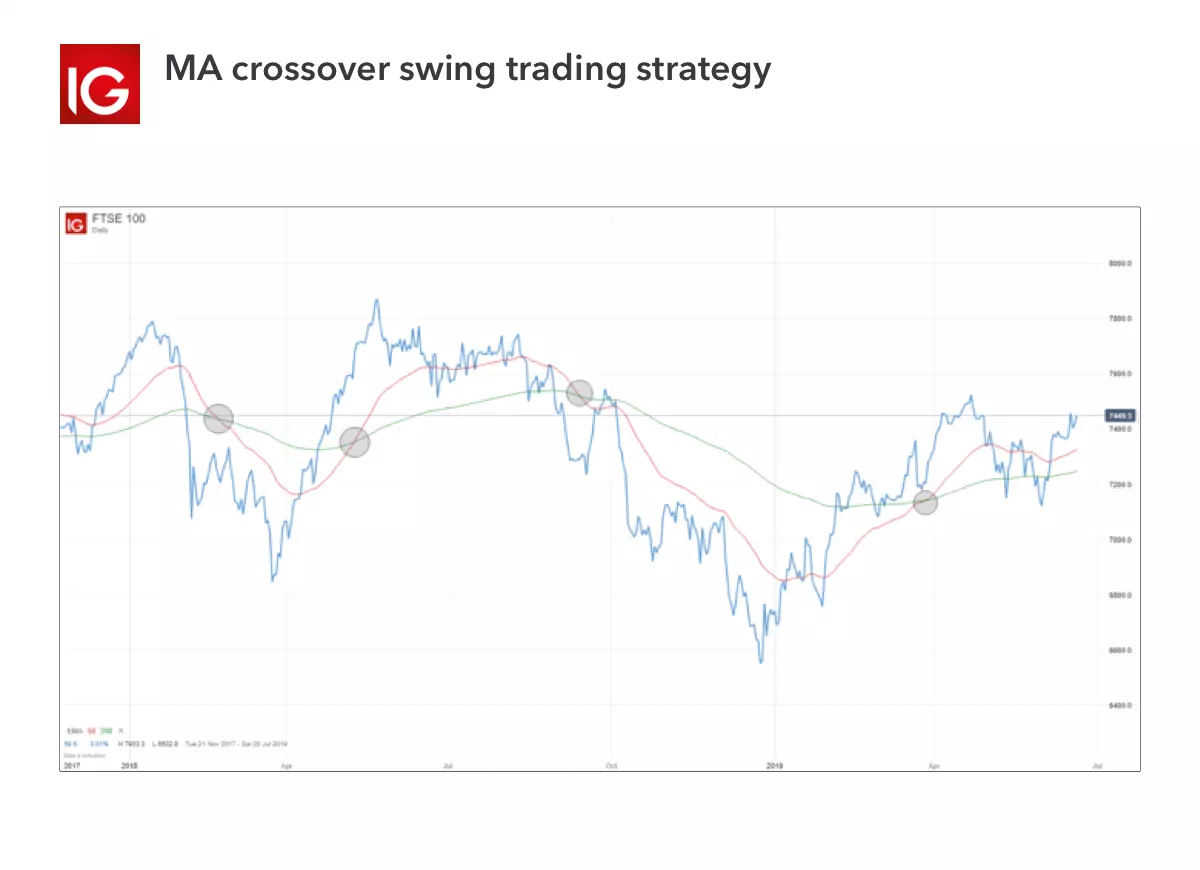
A common moving average strategy is to look for crossovers between two exponential moving averages, which give a greater weighting to more recent price data – unlike a standard MA. Normally, this strategy uses one fast exponential moving average (EMA) such as the 50-day EMA in the chart below (the red line) and one slow EMA such as the 100-day EMA below (the green line). The aim is to look for points at which moving averages cross paths, which can signal a change in the price direction. If the fast EMA crosses the slow EMA from below, a swing trader might consider opening a long position, while they would enter into a short position when the fast EMA crosses the slow EMA from above.
Relative strength index (RSI)
Once a trend is identified, a trader could consider using a momentum indicator to try to capture swings in the overall trend. A popular momentum indicator is the RSI, which swing traders can use to judge whether a market is overbought or oversold – meaning the market could be reaching a ‘swing’.
The RSI is classified as an oscillator, as it is represented on a chart from zero to 100. Typically, anything above 70 is thought of as overbought, which is shown in red on the below chart. And if the price falls below the level 30, it is considered oversold, shown in green on the below chart.
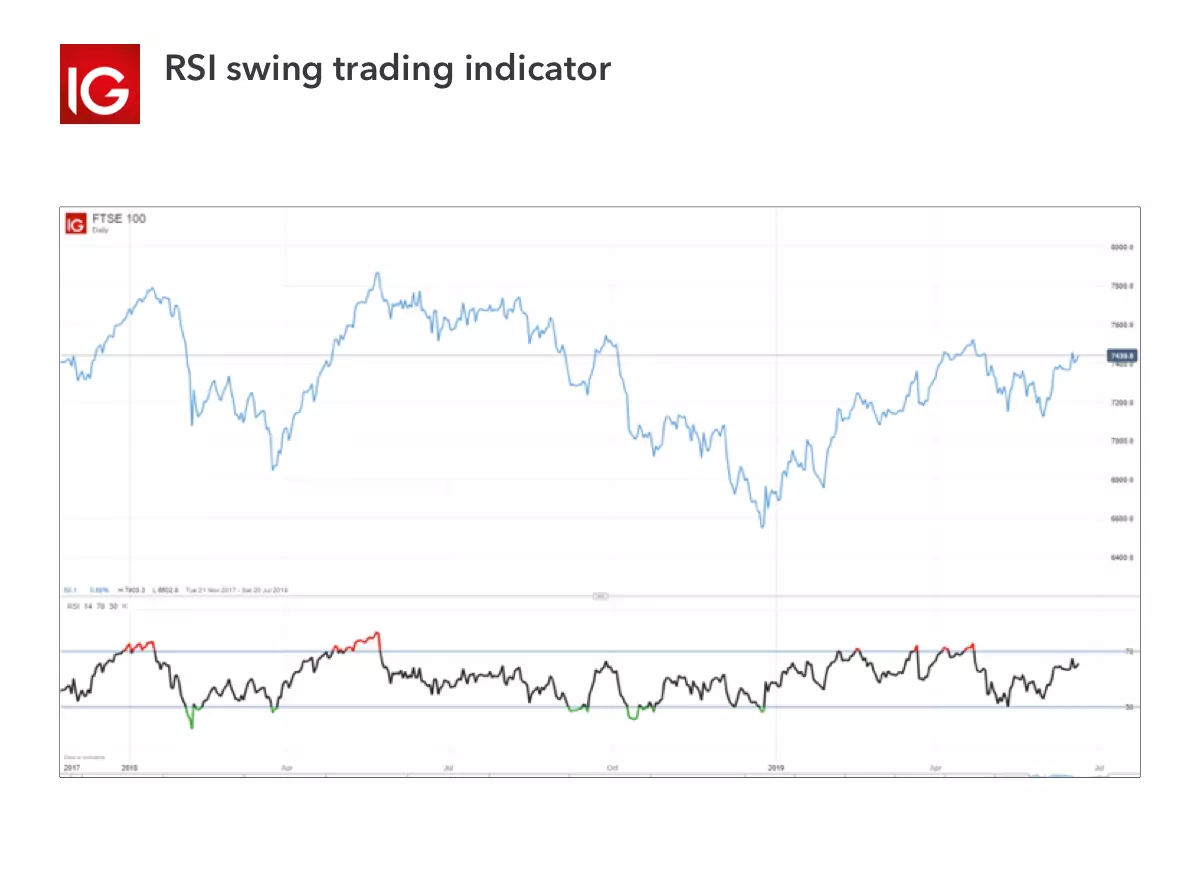
In an uptrend, a move out of oversold territory as indicated by the RSI might be a signal to buy a trade. An overbought signal may be a signal to exit the trade. In a downtrend, a move out of overbought territory might be a signal to enter a short trade, while an oversold signal may be a signal to exit the short trade and not trade against the trend.
Stochastic oscillator
Similar to the RSI, the stochastic oscillator is a momentum indicator. It compares the most recent closing price to the previous trading range for a given period – usually 14 days. The theory behind the stochastic is that market momentum changes ahead of market volume or the price itself, making it a leading indicator. So, by trading based on momentum, a trader can attempt to predict the swings.
The stochastic is presented as two lines – the indicator line (the black line on the below chart) and the signal line (the red dotted line below). These lines oscillate on a scale between zero to 100. If there is a reading over 80, the market would be considered overbought, while a reading under 20 would be considered oversold conditions.
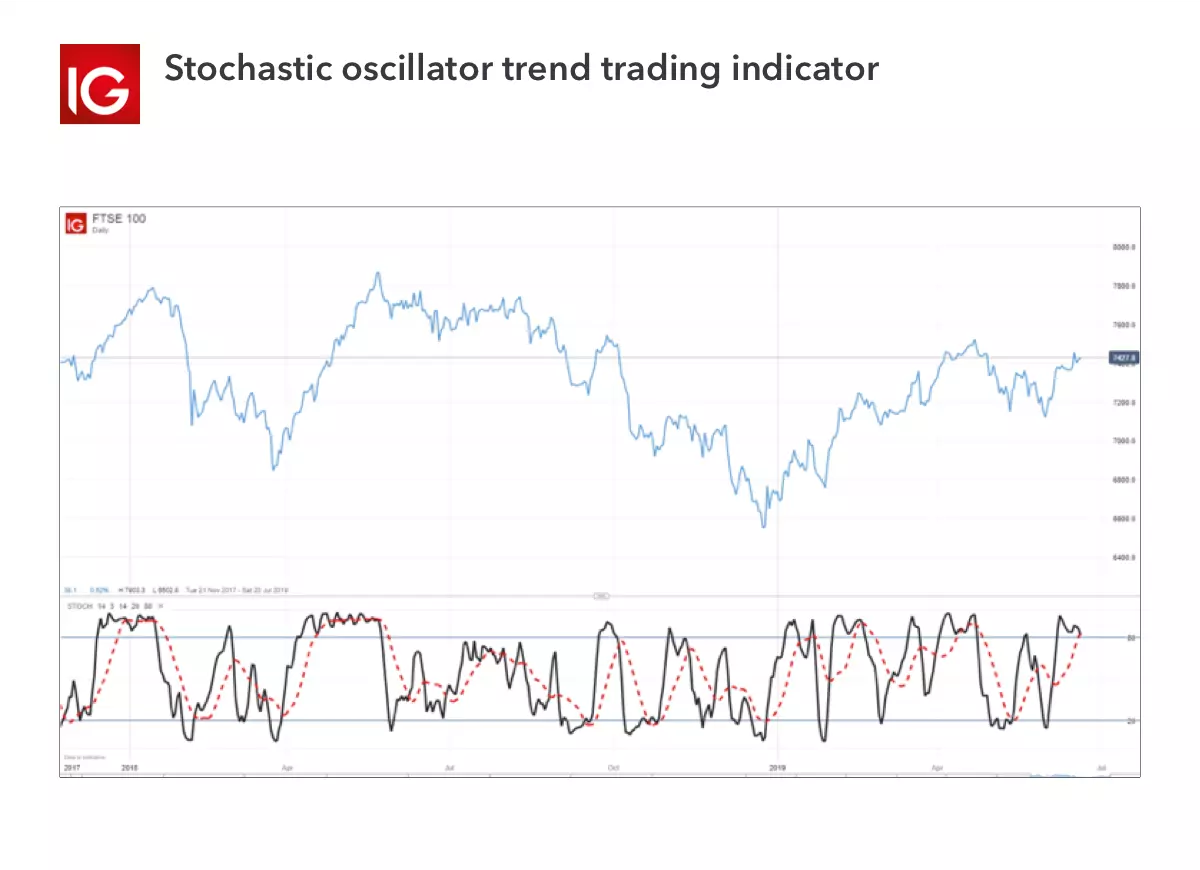
If the two lines cross, it is often a sign that a change in market direction is approaching. If the indicator line rises above the signal line, swing traders might consider opening a long position – unless the values are above 80. And if the indicator line falls lower than the signal line, swing traders might consider opening a short position – unless the values are below 20.
How to start swing trading
There are two ways to start swing trading, depending on your level of confidence and expertise. Your options are:
- Open an account. You can open an account with IG quickly and easily
- Practise trading on a demo account. Test your swing trading strategies in a risk-free environment with an IG demo account
Alternatively, you can join IG Academy to learn more about swing trading and other trading styles.
Swing trading summed up
- Swing trading is a trading style that focuses on trying to capture a portion of a larger move
- It is based on the assumption that market prices rarely move in a straight line, and that traders can find opportunity in the minor oscillations
- Swing trading works by identifying profitable times to enter trades based on two different types of swing: ‘swing lows’ and ‘swing highs’
- You might not always pinpoint the exact high and low of every swing move, but the idea is to capture as much of the price movement as possible
- Swing traders can hold their positions for time periods ranging from a few minutes to longer than a day, as the duration of a swing trade depends on the timeframe of the trend
- Two popular swing trading strategies are range trading and breakout trading, both of which look at short-term market movements
- Swing traders will use technical analysis tools like moving averages, the RSI and stochastic oscillator
This information has been prepared by IG, a trading name of IG Limited. In addition to the disclaimer below, the material on this page does not contain a record of our trading prices, or an offer of, or solicitation for, a transaction in any financial instrument. IG accepts no responsibility for any use that may be made of these comments and for any consequences that result. No representation or warranty is given as to the accuracy or completeness of this information. Consequently any person acting on it does so entirely at their own risk. Any research provided does not have regard to the specific investment objectives, financial situation and needs of any specific person who may receive it. It has not been prepared in accordance with legal requirements designed to promote the independence of investment research and as such is considered to be a marketing communication. Although we are not specifically constrained from dealing ahead of our recommendations we do not seek to take advantage of them before they are provided to our clients.
CFDs are a leveraged products. CFD trading may not be suitable for everyone and can result in losses that exceed your initial deposit, so please ensure that you fully understand the risks involved.

Discover how to trade the markets
Explore the range of markets you can trade – and learn how they work – with IG Academy's free ’introducing the financial markets’ course.
