IG 2024 Outlook
Where to next for the FTSE 100 and S&P 500?
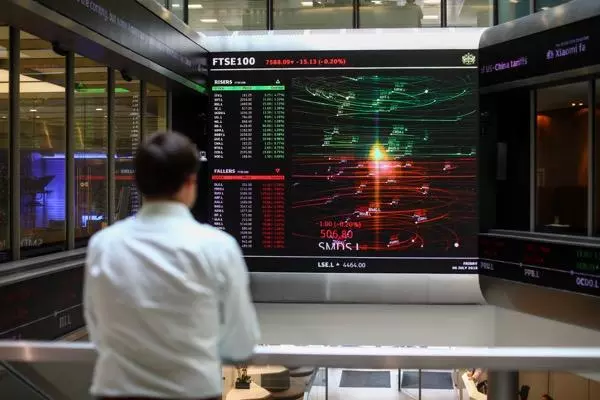

FTSE 100 – Chris Beauchamp
Despite the challenges faced by the FTSE 100 last year, there are signs that the outlook may be brightening. While it has not been the worst performer compared to other indices, such as those in China, it has once again lagged behind the US markets, which have seen a surge in tech stocks.
One of the main reasons for the FTSE 100's struggles has been the impact of the rising dollar, weaker commodity prices, and the ongoing fall in oil prices. Additionally, the uncertainty surrounding Brexit and the 2019 election has left UK markets unloved by investors.
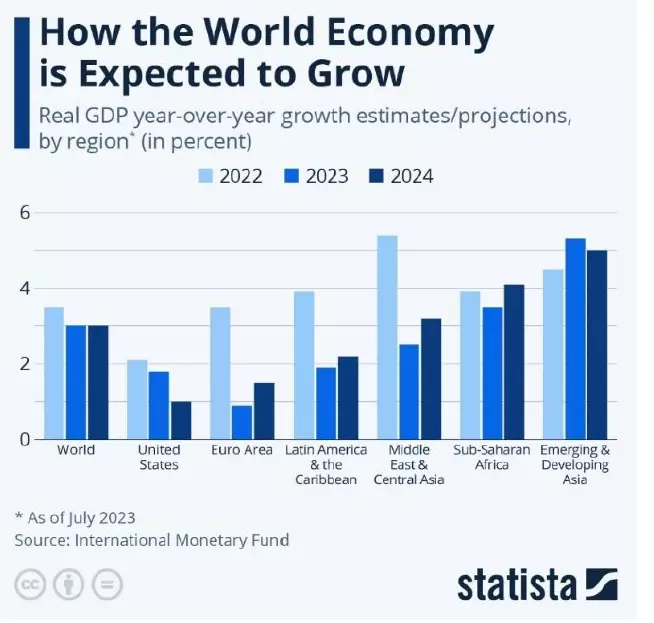
However, there are reasons to be cautiously optimistic. Recession fears have abated, and there is a growing belief that the US and global economies will experience a 'soft landing'. Inflation is expected to cool, and growth is projected to remain in positive territory. Central banks may also implement rate cuts to support growth.
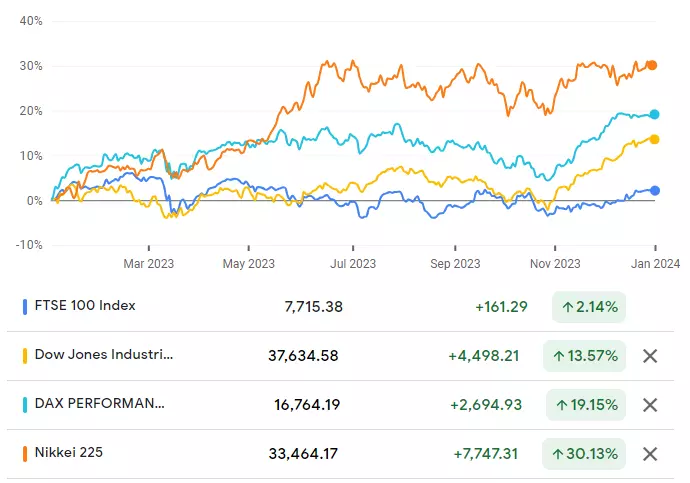
From a valuation perspective, the FTSE 100 appears to be trading at an attractive level. With a price-to-earnings ratio of 11 times, it is much cheaper than the Dax, Dow, and Nikkei, which are trading at 18 times, 22 times, and 26 times earnings, respectively.
Despite the challenges faced by the index in 2023 and the reduction in earnings forecasts for the year, there is still optimism regarding pre-tax profits from the FTSE 100. The expectation is for a 10% increase, surpassing the current inflation rate.
The financial landscape has seen a significant boost in dividends and share buybacks this year. With £47 billion in buybacks announced and £73 billion in dividends paid out so far, companies are demonstrating their commitment to returning value to shareholders.
This positive trend is expected to continue, with total dividends projected to reach an all-time high in 2024. If conditions remain favourable, there is even the possibility of surpassing this record and setting a new one in 2025.
These strong dividends and share buybacks not only benefit shareholders but also indicate the financial health and confidence of the companies involved. It reflects their ability to generate profits and distribute them to investors, which can be seen as a positive sign for the overall market.
Investors should keep a close eye on these developments as they can provide valuable insights into the performance and prospects of individual companies, as well as the broader economic landscape.
Although there is some uncertainty, particularly in the mining sector, several other sectors show potential for ending the year on a positive note. Additionally, broker forecasts indicate the possibility of further growth in earnings and dividends in 2024.
While challenges remain, there is hope that the FTSE 100 can regain its footing and deliver better performance in the future. Investors may find value in the current market conditions and consider the FTSE 100 as a potential opportunity for investment.
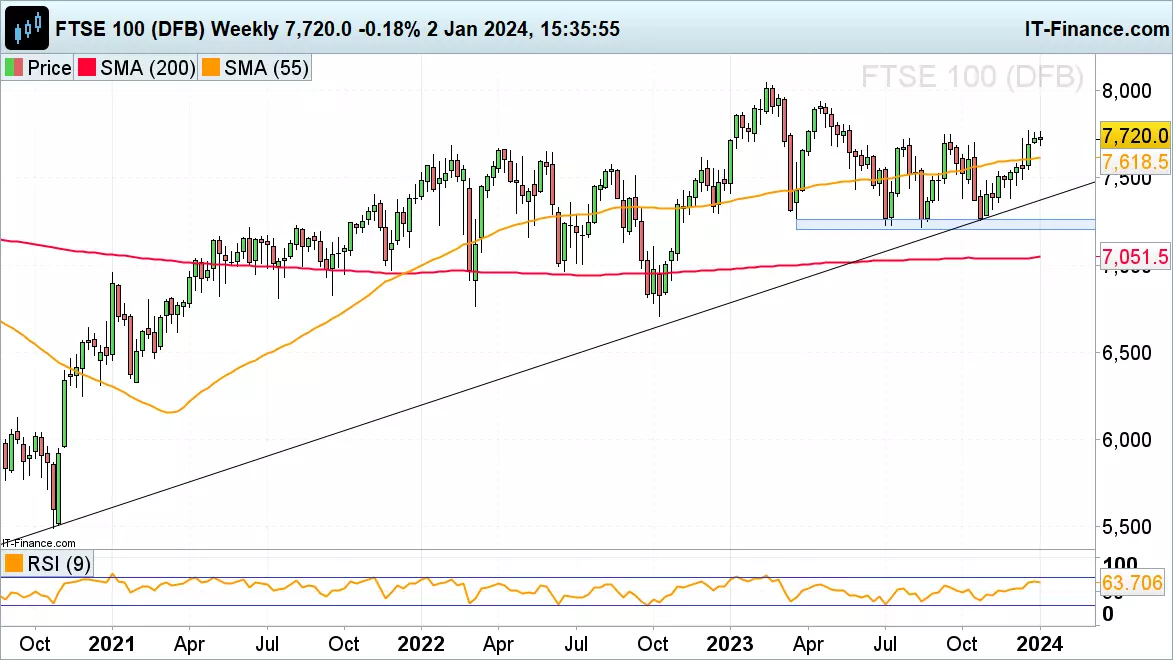
FTSE 100 – technical analysis
The FTSE 100 has managed to claw its way higher from the lows of 2022, but it has not been a smooth journey.
Since it hit its record high in early 2023, the index has been capped by lower highs and trendline resistance. A weekly close above the post-February trendline, i.e. above 7660, would mark a positive development, while gains above 7740, the high from September, would add to the bullish long-term view.
In the medium-term, the highs of February at 8000 then come into view. Early weakness in the new year might see the lows of 2023 around 7250 tested.
S&P 500 – Axel Rudolph
Taking stock of 2023
Despite warnings of a recession in the US by the International Monetary Fund (IMF), the US Federal Reserve (Fed) and several major investment banks at the beginning of the year, the US economy and the country’s stock market(s) have done tremendously well.
US inflation halved from 6.4% in January to 3.2% in October, even if core inflation proved to be stickier at 4.0%, while seasonally-adjusted unemployment rose slightly from 3.4% to 3.9% and gross domestic product (GDP) came in at a respectable 2.1% year-on-year.
At the same time the US 500 has risen by close to 25% in 2023, a positive performance which none of the major investment banks had forecast.
2024 outlook
The S&P 500 is expected to continue its recent advance and might still do well at the beginning of the first quarter (Q1) of next year but then a possible slow down in the US economy may lead to a significant reversal in the trend.
Since earlier in the year the tables have turned with the Fed no longer expecting a recession due to the robustness of the US economy.
The danger, as is often the case when data keeps on coming in better-than-expected and earnings - such as those seen in the Q3 - are pointing to a better outlook for US companies than many had feared, is that investors become complacent.
A potential sign of this complacency is the Chicago Board Option Exchange’s (CBOE) Volatility Index (VIX) which dipped to its lowest level since January 2020 amid seven straight weeks of gains in US equity indices. In that time the Wall Street and S&P 500 rallied by around 15%, the US Tech 100 by just under and the US Russell 2000 (small cap index) by over 20%. The VIX can remain at extremely low levels for several weeks, though, before equity markets top out.
The remarkable recovery in risk appetite, driven by a falling dollar, declining US Treasury yields to between five and seven month lows and Fed rate cut expectations being brought forward to March of next year, is likely to have legs, at least into the first few weeks of 2024. This scenario remains the most probable even if a short-term sell-off at the beginning of next year were to be seen.
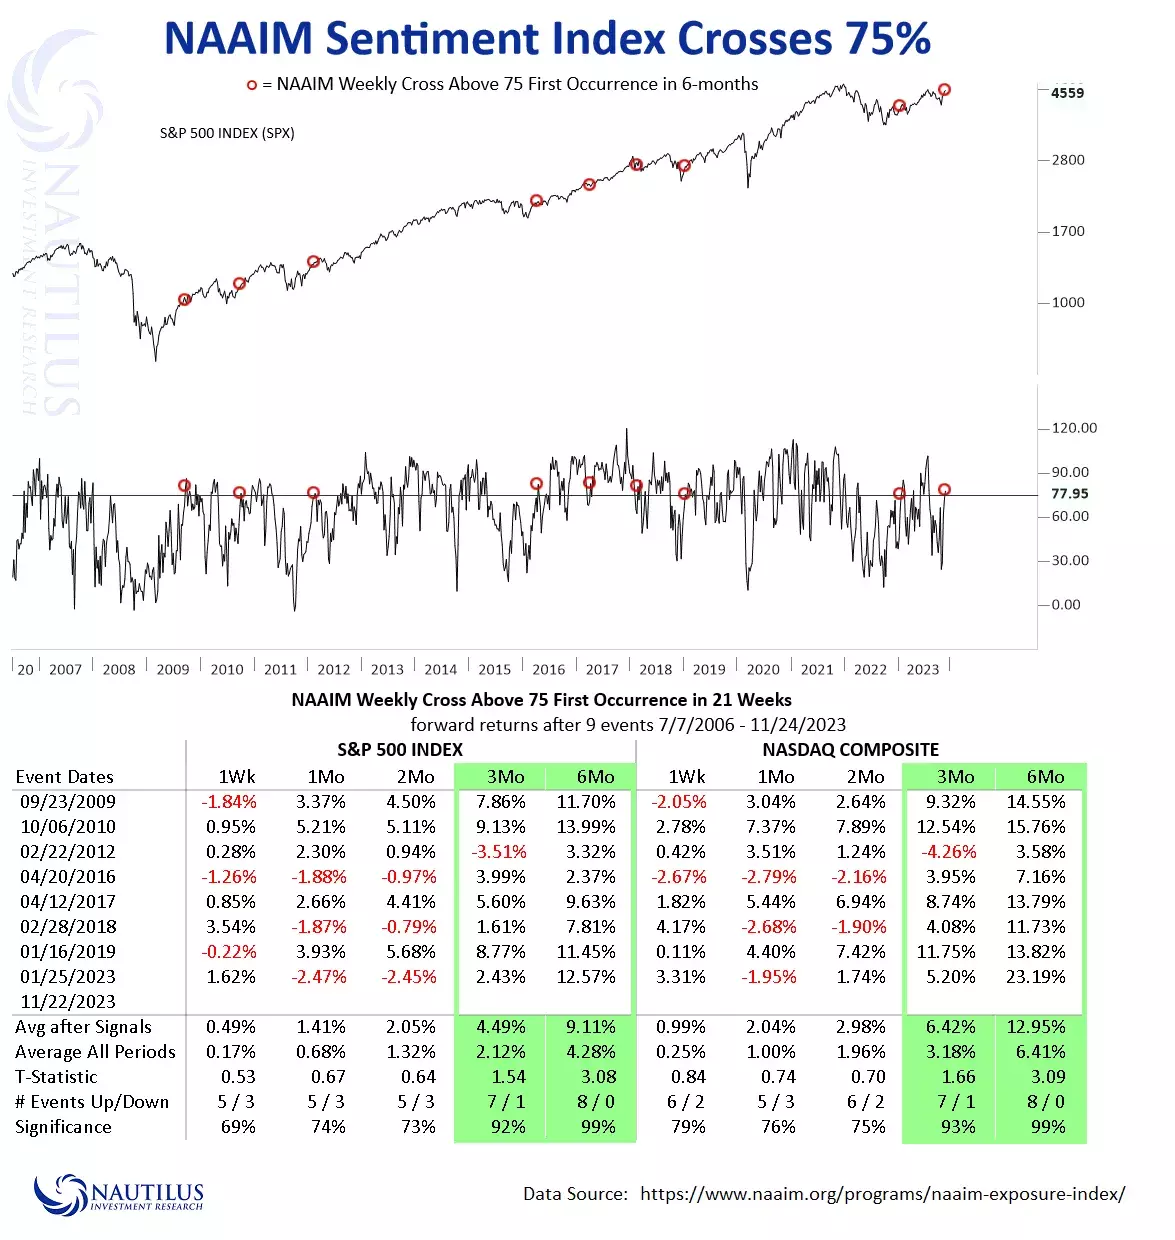
Bullish factors are that over 55% of S&P 500 stocks now trade above their 200-day simple moving averages (SMA), the National Association of Active Investment Managers (NAAIM) Sentiment Index has been trading above 75 this past month and seasonality usually leads to end-of year gains.
Stocks trading above their 200-day SMA are considered to be long-term bullish. Now that over half the S&P 500’s stocks are trading above their 200-day SMAs the bull market looks to be more solid than it was in the first half of this year.
When the NAAIM Sentiment Index crosses 75 for the first time in 21 weeks, the three- and six-month forward returns have all been bullish, some in double digits, between mid-2006 and now. The only exception has been the three-month period following such as signal in February 2012 but even then a positive 3.32% performance was seen after six-months.
NAAIM Sentiment Index Chart and data table
Then there is the ‘Santa Claus Rally’: according to StockTradersAlmanac.com, since 1950, the S&P 500 is up 79.45% of the time from the Tuesday before Thanksgiving to the 2nd trading day of the year with an average gain of 2.57%.
There is an important caveat to the “Santa Claus Rally” though, coined by its 1972 inventor Yale Hirsch’s phrase: “If Santa Claus should fail to call, bears may come to Broad and Wall.”
Risks for 2024
The same risks the Fed and others feared at the beginning of the year are still bubbling under the surface.
These are:
- rapidly rising short-end interest rates
- a spike in inflation
- inversions of the yield curve
- and oil price shocks
Even if these occurrences haven’t as yet led to a recession in the US in 2023, they may well do so in 2024.
A Deutsche Bank team led by Jim Reid, head of global economics and thematic research, in November highlighted these four key macroeconomic triggers that have caused recessions in the past and analysed 34 US recessions dating back to 1854, looking for patterns in economic history.
For each trigger, the Deutsche Bank team calculated a historical “hit ratio”—or the percentage of times when these events occurred that led to a recession.
Even though they found that no single macroeconomic trigger can accurately predict a recession, all four together – as is the case at present - greatly increase the odds of a US recession rearing its head.
The rapid rise in interest rates since the Q1 of 2022 from 0% to 0.25% to the current Fed funds at 5.25% to 5.50% - by more than 5% - is bound to weigh on economic growth by raising the cost of borrowing for businesses and consumers but may take time to work its way through the economy.
According to Deutsche Bank’s study, since 1854, when US short-term interest rates have risen by 2.5 percentage points over a 24-month period, there has been a recession within three years around 69% of the time.
Also since 1854, a three percentage point rise in inflation over a 24-month period has caused a recession within three years 77% of the time.
The fact that US inflation soared to a four-decade high to 9.1% in June of 2022, even if it has since retreated to a much milder 3.2%, points to a probable recession since historically the US economy hasn’t managed inflationary spikes very well.
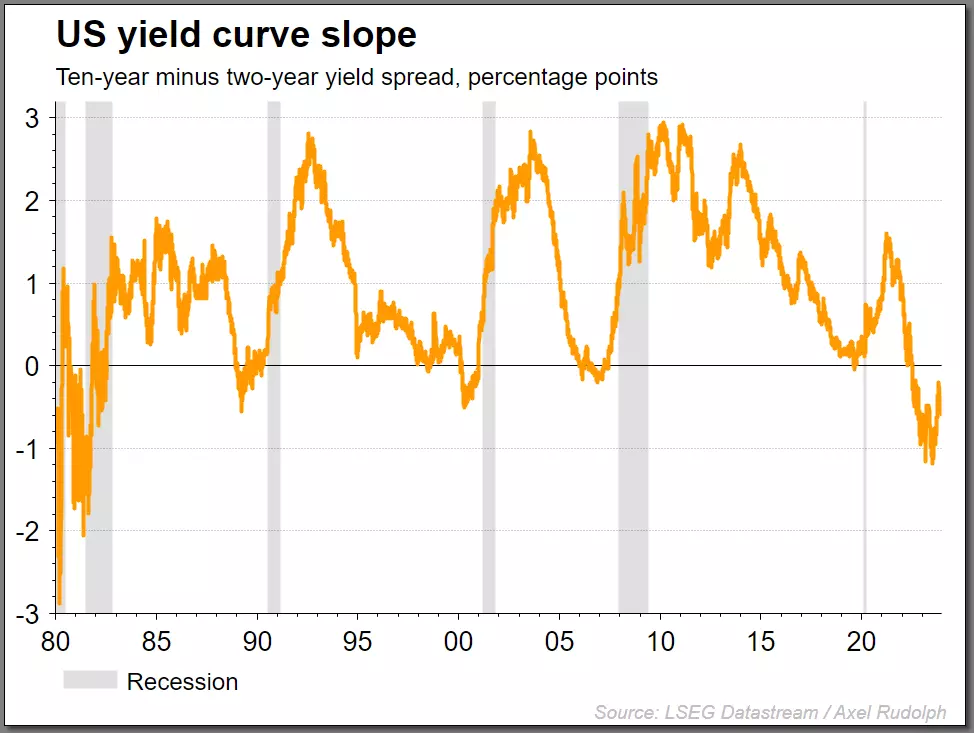
An inverted yield curve - when short-term bonds end up yielding more than long-term bonds - has caused a US recession in 74%, but since the 1953 recession, in nearly 80% of cases, the Deutsche Bank study shows.
US Treasuries have been inverted since July 2022 but may normalise in 2024. Historically when the yield curve un-inverts, as investors take more risk when loaning out their money on longer-term time frames and thus want to be compensated for this by a higher yield, a recession tends to follow.
US 10-year minus 2-year yield curve slope and US recessions chart
Last but not least an oil price shock has led to a US recession 45% of the time, according to the Deutsche Bank research team.
Oil - US Crude prices have risen by nearly 40% from June to September, to close to $95 per barrel, leading many economists to fear inflation could prove to be more sticky than the Fed might have imagined. This fear might be mitigated by the sharp over 20% drop in the oil price from its late-September peak to current levels.
The Deutsche Bank study aside, there is another factor that might need considering and it is that since the 1950s nearly each time the first US rate cut was made after a hiking cycle, a US recession followed in the coming year(s). Since the first Fed fund rate cut is currently expected to be seen in March of next year, a recession might be on the table for the latter half of 2024.
S&P 500 technical analysis forecast
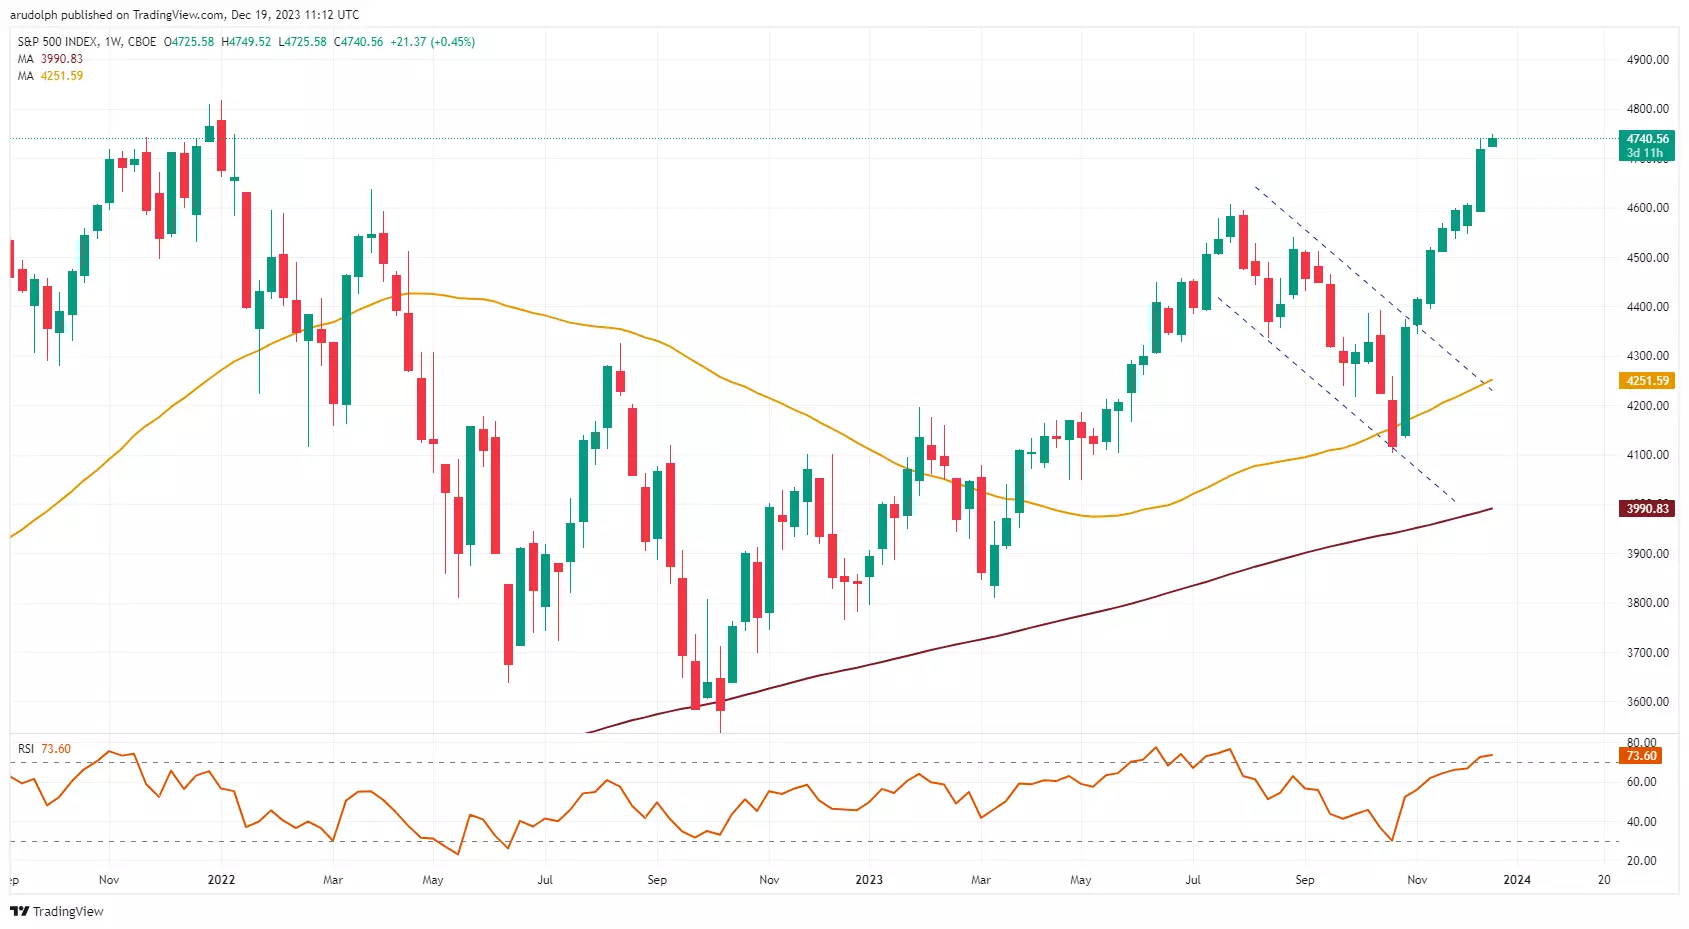
Since the strong November gains occurred after the S&P 500 broke out of a ‘bull flag’ technical chart pattern at 4,356, it is to be expected that during the first half of 2024 the index is not only likely to exceed its January 2022 all-time record high at 4,818.62 but may also reach the psychological 5,000 zone before a possible significant correction or bear market unfolds.
The reason is that the near 800-point ‘flagpole’ in that ‘bull flag’ pattern - the March-to-July advance – is projected from the pattern breakout point at 4,356, giving technical analysts a potential upside target of 4,536 plus 800 = 5,336.
S&P 500 Weekly Candlestick Chart
This information has been prepared by IG, a trading name of IG Limited. In addition to the disclaimer below, the material on this page does not contain a record of our trading prices, or an offer of, or solicitation for, a transaction in any financial instrument. IG accepts no responsibility for any use that may be made of these comments and for any consequences that result. No representation or warranty is given as to the accuracy or completeness of this information. Consequently any person acting on it does so entirely at their own risk. Any research provided does not have regard to the specific investment objectives, financial situation and needs of any specific person who may receive it. It has not been prepared in accordance with legal requirements designed to promote the independence of investment research and as such is considered to be a marketing communication. Although we are not specifically constrained from dealing ahead of our recommendations we do not seek to take advantage of them before they are provided to our clients.
CFDs are a leveraged products. CFD trading may not be suitable for everyone and can result in losses that exceed your initial deposit, so please ensure that you fully understand the risks involved.

Seize your opportunity
Deal on the world’s stock indices today.
- Trade on rising or falling markets
- Get one-point spreads on the FTSE 100
- Unrivalled 24-hour pricing
See opportunity on an index?
Try a risk-free trade in your demo account, and see whether you’re on to something.
- Log in to your demo
- Try a risk-free trade
- See whether your hunch pays off
See opportunity on an index?
Don’t miss your chance – upgrade to a live account to take advantage.
- Get spreads from one point on the FTSE 100
- Trade more 24-hour indices than any other provider
- Analyse and deal seamlessly on smart, fast charts
See opportunity on an index?
Don’t miss your chance. Log in to take your position.
Live prices on most popular markets
- Forex
- Shares
- Indices
Prices above are subject to our website terms and agreements. Prices are indicative only. All shares prices are delayed by at least 15 mins.

