Gold and natural gas head lower, but oil prices make gains
Gold and natural gas retain a more bearish outlook, while oil prices are aiming for a recovery after losses earlier in the week.
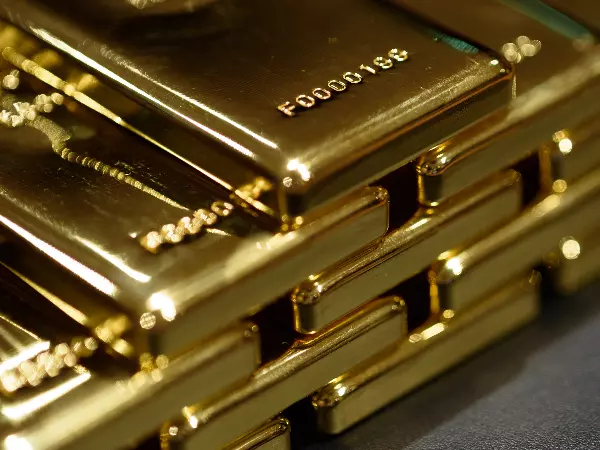

Gold remains under pressure
The gold price managed to stave off further declines yesterday, after two days of retreating from the $2000 level.
This now brings the 50-day simple moving average (SMA) back into focus, and further losses today should put additional pressure on the price. Below the 50-day SMA, the support zone around $1900 comes into view, last tested in the second half of March.
An upside case requires a rally back above $1998, reversing the losses seen in the first part of the week.
For the time being this does not seem like a particularly high-probability event, although a weaker dollar could provide the break gold has been looking for.

WTI moves higher off 50-day SMA
Here a more bullish view has begun to emerge, after the price suffered a reverse during the first part of this week. After breaking out above trendline resistance at the end of last week, the price then pushed on to $108. However, it was unable to sustain these gains and fell back.
Early trading today has found the price bouncing off the rising 50-day SMA, a positive sign, especially following yesterday’s bounce off the lows that found support at the previous trendline resistance line. This now puts $108 back into contention, and from there the late March high at $114.83 comes into view.
A more bearish outlook would require a reversal below $100, putting the price below yesterday’s lows and potentially marking a false breakout above trendline resistance. This might bring the lows around $94 into view.

Natural gas retreats from recent highs
The price continued to soar into the beginning of the week, and only now has encountered some selling pressure.
Steep trendline support from early March could come into play soon in the event of additional declines today. A move below 6500 puts the price below trendline support and would suggest that a move back towards 5500 could be in the offing.
Before this, 6255 comes in as possible support, in the event of additional declines in the short-term.

This information has been prepared by IG, a trading name of IG Limited. In addition to the disclaimer below, the material on this page does not contain a record of our trading prices, or an offer of, or solicitation for, a transaction in any financial instrument. IG accepts no responsibility for any use that may be made of these comments and for any consequences that result. No representation or warranty is given as to the accuracy or completeness of this information. Consequently any person acting on it does so entirely at their own risk. Any research provided does not have regard to the specific investment objectives, financial situation and needs of any specific person who may receive it. It has not been prepared in accordance with legal requirements designed to promote the independence of investment research and as such is considered to be a marketing communication. Although we are not specifically constrained from dealing ahead of our recommendations we do not seek to take advantage of them before they are provided to our clients.
CFDs are a leveraged products. CFD trading may not be suitable for everyone and can result in losses that exceed your initial deposit, so please ensure that you fully understand the risks involved.

React to volatility on commodity markets
Trade commodity futures, as well as 27 commodity markets with no fixed expiries.
- Wide range of popular and niche metals, energies and softs
- Spreads from 0.3 pts on Spot Gold, 2 pts on Spot Silver and 2.8 pts on Oil
- View continuous charting, backdated for up to five years
See opportunity on a commodity?
Try a risk-free trade in your demo account, and see whether you’re on to something.
- Log in to your demo
- Try a risk-free trade
- See whether your hunch pays off
See opportunity on a commodity?
Don’t miss your chance – upgrade to a live account to take advantage.
- Analyse and deal seamlessly on fast, intuitive charts
- Get spreads from just 0.3 points on Spot Gold
- See and react to breaking news in-platform
See opportunity on a commodity?
Don’t miss your chance. Log in to take your position.
Live prices on most popular markets
- Forex
- Shares
- Indices
Prices above are subject to our website terms and agreements. Prices are indicative only. All shares prices are delayed by at least 15 mins.
