FOMC takeaways: What’s in it for US dollar, Gold, Russell 2000?
Heading into the meeting, the key focus had been on whether US policymakers’ views will be more aligned on the series of rate cuts priced in 2024 and the Fed has clearly delivered.


FOMC takeaways
As broadly expected, the Federal Reserve (Fed) has kept rates unchanged at 5.25%-5.5% for the third straight meeting overnight. In the policy statement, acknowledgement of slowing economic growth and easing inflation in the third quarter, alongside a wording change to indicate a softer tightening bias, further confirmed views that the Fed’s hiking cycle has reached its end.
Heading into the meeting, the key focus had been on whether US policymakers’ views will be more aligned on the series of rate cuts priced in 2024 and the Fed has clearly delivered. The median dot plot has priced out any additional hike and now sees 75 basis point (bp) worth of rate cuts in 2024, versus the 50 bp cut in September. While that is still less aggressive than the 100-125 bp cuts priced by markets before the meeting, market participants viewed the shift in stance as sufficiently dovish and the lack of a pushback on rate cuts may caught some by surprise, given the hawkish tone coming from policymakers just last month.
In the economic projections, the core Personal Consumption Expenditures (PCE) inflation forecasts were revised downwards through 2025. Unemployment rate were kept unchanged from the September projection (4.1% in 2024 and 2025), while gross domestic product (GDP) forecasts saw a slight revision to 1.4% in 2024 from previous 1.5%. Overall, the soft-landing narrative is still broadly intact and along with rate-cuts validation from the Fed, there seems to be little in the way to stop the risk rally.
US dollar pared all month-to-date gains on Fed’s dovish rhetoric
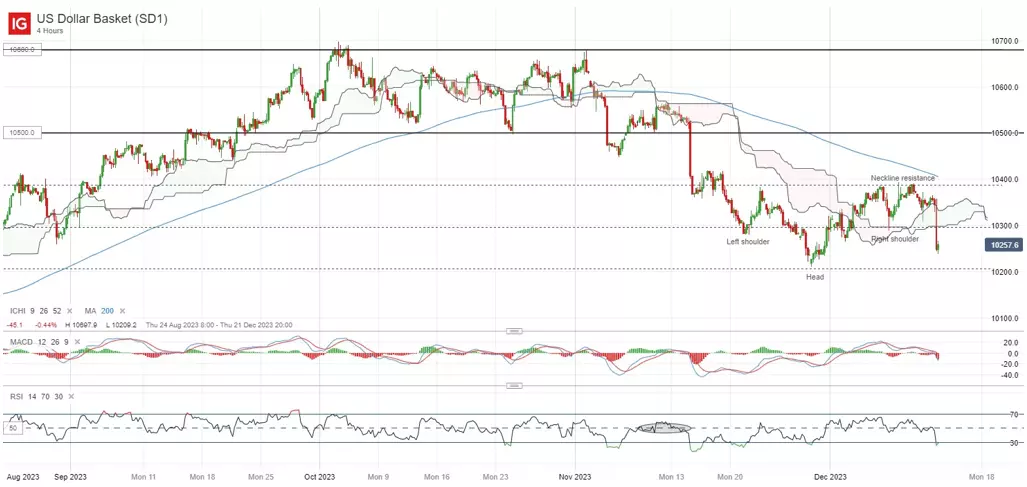
Having earlier formed an inverse head-and-shoulder formation on the four-hour chart, the dovish rhetoric from the Fed has not been supportive for a neckline breakout at the 103.86 level. The US dollar index has since pared back all of its month-to-date gains, crashing back below its key 200-day moving average (MA) on the daily chart. Its daily relative strength index (RSI) has also failed to cross above the 50 level lately, leaving its near-term downward trend intact.
Further downside will leave the 102.00 level on watch, which marks its November 2023 low. Failure for the level to hold could see the 100.50 level next. On the upside, buyers may face an arduous task with several resistance overhead in place, which includes its 200-day MA and the 103.86 level.
Gold prices eyeing for a move back to retest key resistance
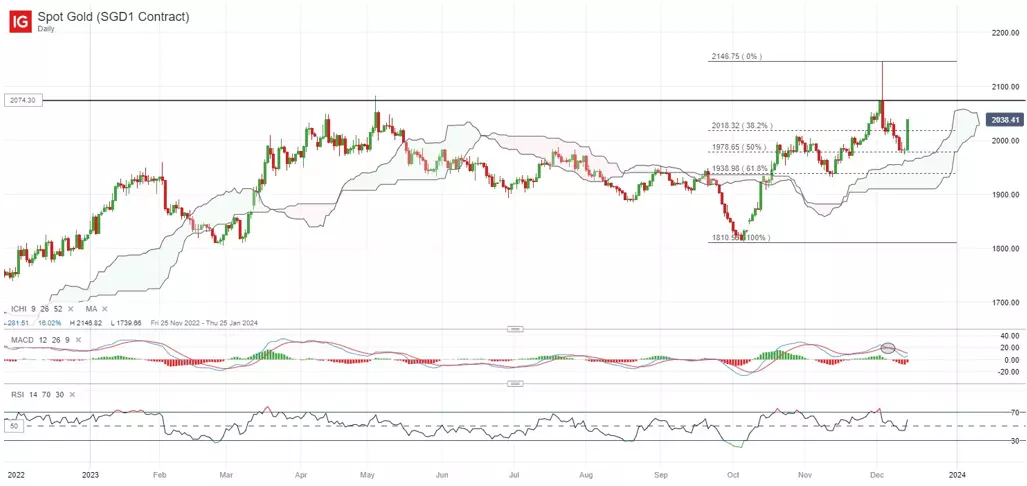
After failing to sustain a breakout above the US$2,074 level back on 4 December 2023, the yellow metal has found new signs of life overnight, with the green light on the rate-cuts narrative from the Fed. The overnight upmove has pared all of this week’s losses, with prices seemingly setting its sight for another retest of the US$2,074 level of resistance, which marked a crucial overhead resistance on multiple previous occasions (May 2023, March 2022 and August 2020).
For now, the broader upward trend remains intact, with prices trading after its Ichimoku cloud zone on the daily chart after an upward break in October 2023, alongside various MAs. A successful move above the US$2,074 level may pave the way towards the all-time high at the US$2,146 level next. On the downside, the daily Ichimoku cloud zone will serve as an area of support for buyers to defend.
Can Russell 2000 deliver a breakout from its broad ranging pattern?
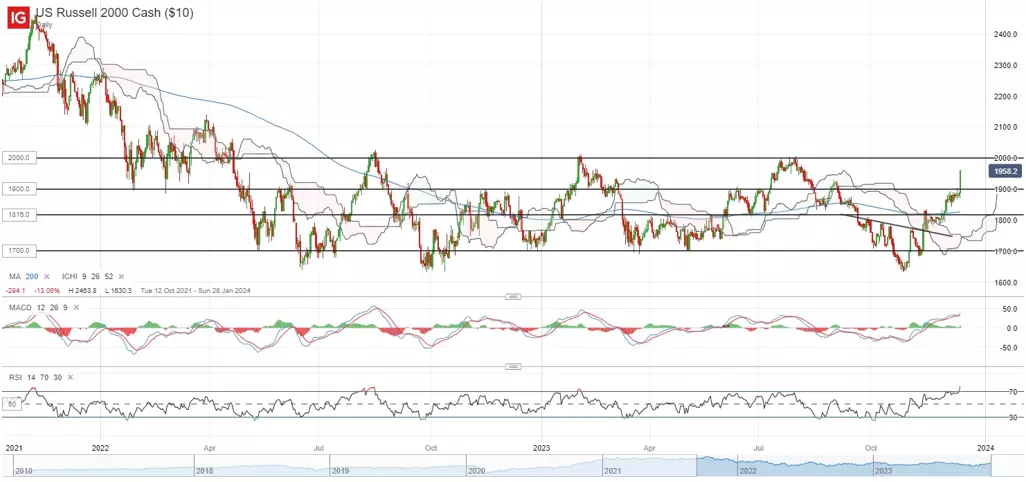
Small-cap stocks have been playing catch-up lately, with the Russell 2000 surging 8.3% over the past month, outperforming the Nasdaq’s and S&P 500’s 4.7%. A reclaim of its 200-day MA in early-December this year has been encouraging, with the index standing just less than 3% away from a crucial resistance at the key psychological 2,000 level.
Having largely traded in a broad ranging pattern since May 2022, the 2,000 level marked the upper bound of the range, which has weighed on the index on multiple occasions. Any successful breakout above the range will be significant, potentially paving the way towards the 2,108 level next. On the downside, immediate support may stand at the 1,900 level.
Wednesday: DJIA +1.40%; S&P 500 +1.37%; Nasdaq +1.38%, DAX -0.15%, FTSE +0.08%
This information has been prepared by IG, a trading name of IG Limited. In addition to the disclaimer below, the material on this page does not contain a record of our trading prices, or an offer of, or solicitation for, a transaction in any financial instrument. IG accepts no responsibility for any use that may be made of these comments and for any consequences that result. No representation or warranty is given as to the accuracy or completeness of this information. Consequently any person acting on it does so entirely at their own risk. Any research provided does not have regard to the specific investment objectives, financial situation and needs of any specific person who may receive it. It has not been prepared in accordance with legal requirements designed to promote the independence of investment research and as such is considered to be a marketing communication. Although we are not specifically constrained from dealing ahead of our recommendations we do not seek to take advantage of them before they are provided to our clients.
CFDs are a leveraged products. CFD trading may not be suitable for everyone and can result in losses that exceed your initial deposit, so please ensure that you fully understand the risks involved.

Act on stock opportunities today
Go long or short on thousands of international stocks with CFDs.
- Get full exposure for a comparatively small deposit
- Trade on spreads from just 0.1%
- Get greater order book visibility with direct market access
See opportunity on a stock?
Try a risk-free trade in your demo account, and see whether you’re on to something.
- Log in to your demo
- Try a risk-free trade
- See whether your hunch pays off
See opportunity on a stock?
Don’t miss your chance – upgrade to a live account to take advantage.
- Trade a huge range of popular stocks
- Analyse and deal seamlessly on fast, intuitive charts
- See and react to breaking news in-platform
See opportunity on a stock?
Don’t miss your chance. Log in to take advantage while conditions prevail.
Live prices on most popular markets
- Forex
- Shares
- Indices
Prices above are subject to our website terms and agreements. Prices are indicative only. All shares prices are delayed by at least 15 mins.
