EUR/USD, EUR/GBP and GBP/USD form interim tops
Outlook on EUR/USD, EUR/GBP and GBP/USD amid pared back rate cut expectations.

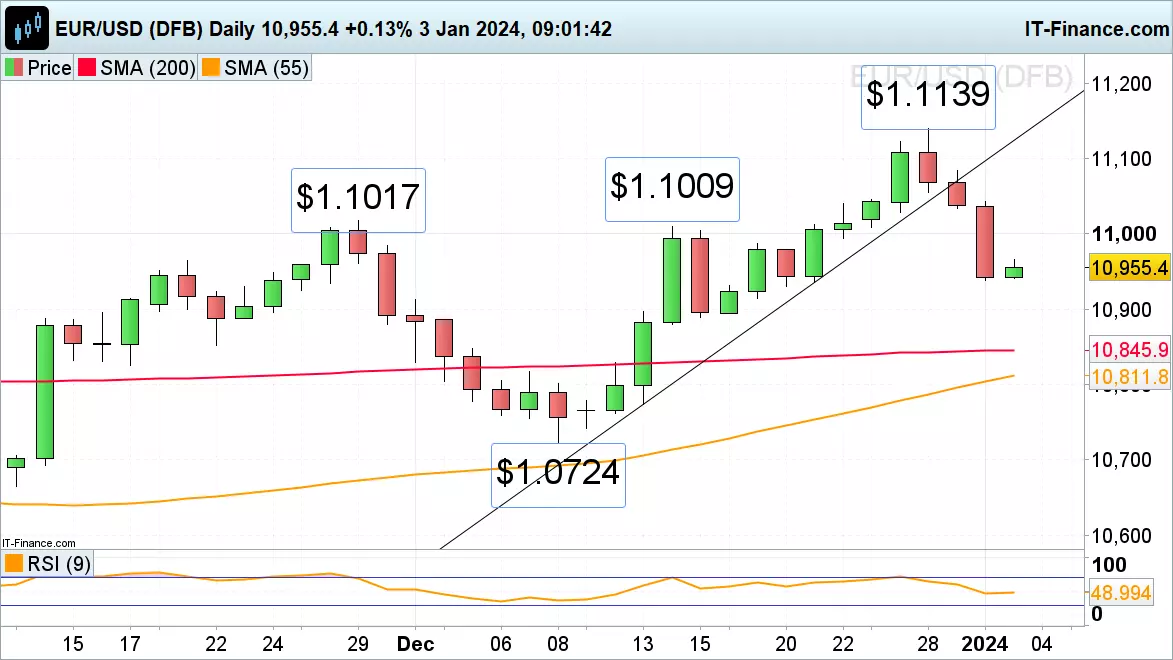
EUR/USD drops for three straight days as greenback regains lost ground
EUR/USD's bearish reversal off its December $1.1139 high, made near its 27 July high at $1.1149, has so far taken it to Tuesday’s $1.0939 low as excessive rate cut expectations were pared back and yields rallied.
Further downside remains likely with the $1.09 region and the 200-day simple moving average (SMA) at $1.0846 representing possible targets. Good resistance can be spotted between the $1.1009 to $1.1017 November and mid-December highs.
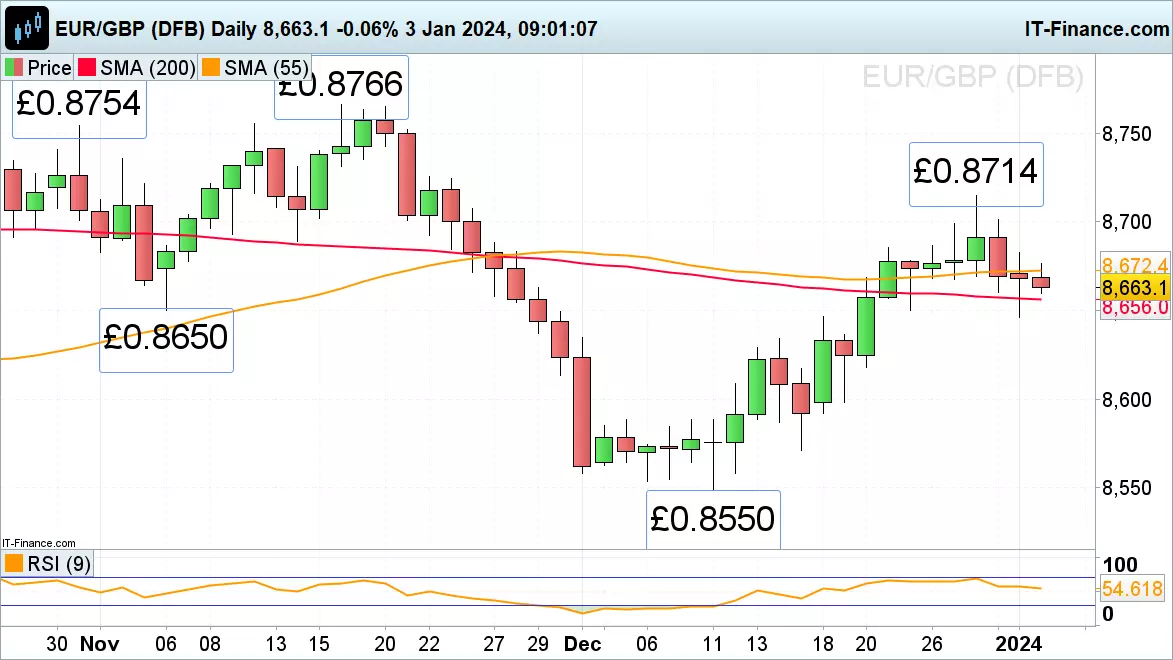
EUR/GBP flirts with 200-day SMA
EUR/GBP’s drop from its £0.8714 December high has taken it back to the 200-day SMA at £0.8656 and Tuesday’s low at £0.8646 as investors position themselves for the new year.
A slip through £0.8646 would engage the mid-December high at £0.8634 whereas a rise above the 55-day SMA at £0.8672 would put Tuesday’s high at £0.8682 and the 21 December peak at £0.8685 on the cards.
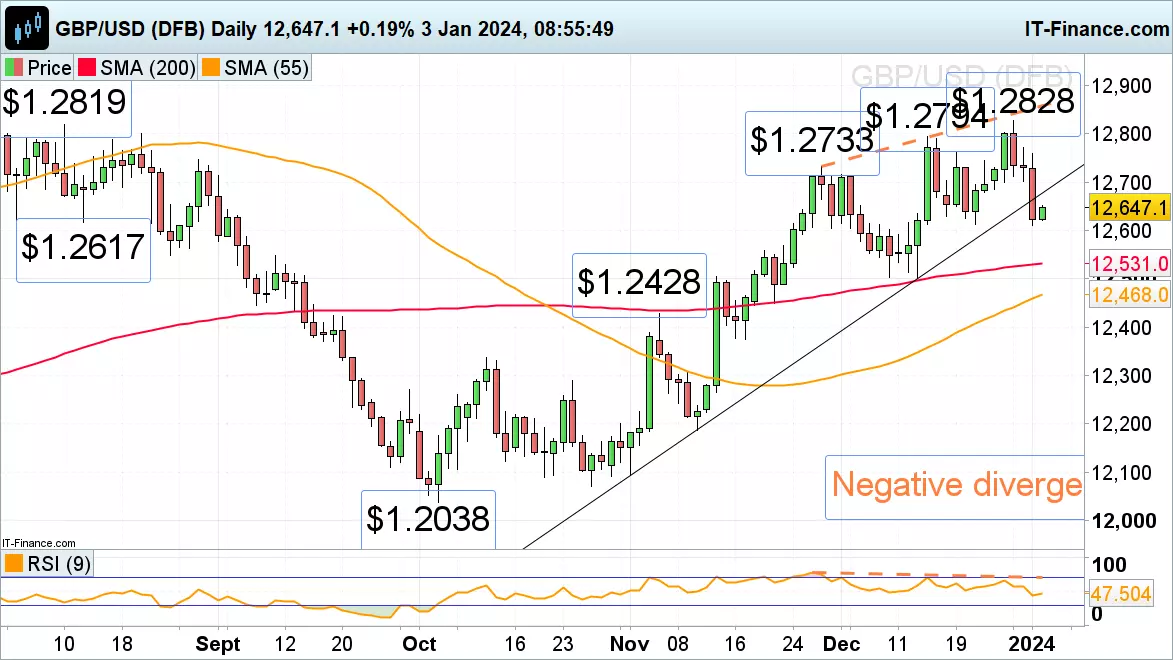
GBP/USD forms interim top
GBP/USD briefly made a new five-month high at $1.2828 in late December before giving back some of its gains as traders bought back their short US dollar positions and as the greenback appreciated on pared back rate cut expectations which led to higher US Treasury yields.
Negative divergence on the daily Relative Strength Index (RSI) warned of a sell-off in the GBP/USD pair which on Tuesday flirted with its 21 December low at $1.2612. While it and Tuesday’s $1.2611 low hold on a daily chart closing basis, the breached November-to-January uptrend line, now a resistance line, at $1.2678 may be retested. Further up minor resistance can be spotted at Thursday’s $1.2701 low. A fall through the $1.2612 to $1.2611 support zone would put the 200-day SMA at $1.2531 and the December low at $1.2501 on the map.
This information has been prepared by IG, a trading name of IG Limited. In addition to the disclaimer below, the material on this page does not contain a record of our trading prices, or an offer of, or solicitation for, a transaction in any financial instrument. IG accepts no responsibility for any use that may be made of these comments and for any consequences that result. No representation or warranty is given as to the accuracy or completeness of this information. Consequently any person acting on it does so entirely at their own risk. Any research provided does not have regard to the specific investment objectives, financial situation and needs of any specific person who may receive it. It has not been prepared in accordance with legal requirements designed to promote the independence of investment research and as such is considered to be a marketing communication. Although we are not specifically constrained from dealing ahead of our recommendations we do not seek to take advantage of them before they are provided to our clients.
CFDs are a leveraged products. CFD trading may not be suitable for everyone and can result in losses that exceed your initial deposit, so please ensure that you fully understand the risks involved.

Start trading forex today
Find opportunity on the world’s most-traded – and most-volatile – financial market
- Trade spreads from just 0.6 points on EUR/USD
- Analyse with clear, fast charts
- Speculate wherever you are with our intuitive mobile apps
See an FX opportunity?
Try a risk-free trade in your demo account, and see whether you’re onto something.
- Log in to your demo
- Try a risk-free trade
- See whether your hunch pays off
See an FX opportunity?
Don’t miss your chance – upgrade to a live account to take advantage.
- Get spreads from just 0.6 points on popular pairs
- Analyse and deal seamlessly on fast, intuitive charts
- See and react to breaking news in-platform
See an FX opportunity?
Don’t miss your chance. Log in to take your position.
Live prices on most popular markets
- Forex
- Shares
- Indices
Prices above are subject to our website terms and agreements. Prices are indicative only. All shares prices are delayed by at least 15 mins.
