Can the Nikkei 225, Hang Seng, Dow and Russell 2000 follow the Nasdaq 100 & CAC 40’s lead?
How laggards such as the Dow Jones Industrial Average, Hang Seng and Russell 2000 compare to their peers and are they likely to catch up anytime soon?

Global stock markets have resumed their 2023 ascents
Global stock markets have been on an upward trajectory since March and seem to have shrugged off the banking crisis with the likes of the US Tech 100 rising by over 20% year-to-date and the French France 40 trading in new all-time record highs.
Weaker economic data which point to a likely recession in the US later this year, together with lower-than-expected US Consumer Price and Producer Price inflation (CPI and PPI) provided just enough bad news to give markets fresh hope that the Federal Reserve (Fed) will pause its hiking cycle beyond the next meeting, boosting global equity indices once more.
Now that the Q1 earnings season got off to a good start on Friday which saw JPMorgan Chase & Co (24 Hours)’s profit climb 52% year-on-year to $12.6 billion, or $4.10 a share, widely beating estimates, the question is whether other Q1 earnings, not just in the banking sector, can follow suit.
With negative guidance abounding and earnings estimates having been pruned in recent weeks, further positive earnings surprises might be in the pipeline.
Having said that, the impact the banking crisis has had on lending activity and credit conditions will also have its part to play and may still dampened the mood, as may more negative economic data which could point to a hard landing of the US economy.
Where to next for the Nikkei 225?
When looking beyond US and European equity indices, several of the latter trading in fresh one-year highs, the focus falls on Asia and, for example, the Japan 225.
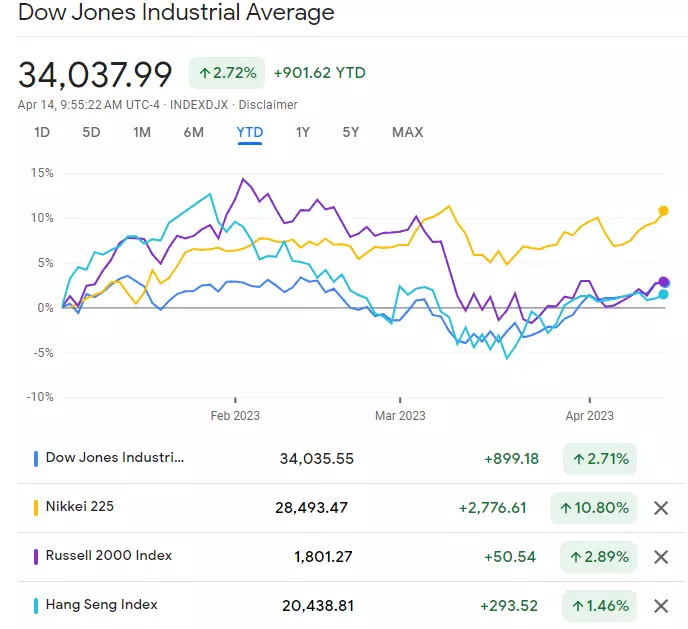
Its year-to-date performance of over 10% is in line with and even slightly better than that of several of its US peers such as the US 500 with 8.5%, for example, whilst it is also faring better than laggards such as the Wall Street (Dow), Hong Kong HS50 and US Russell 2000.
Major global equity indices comparison chart
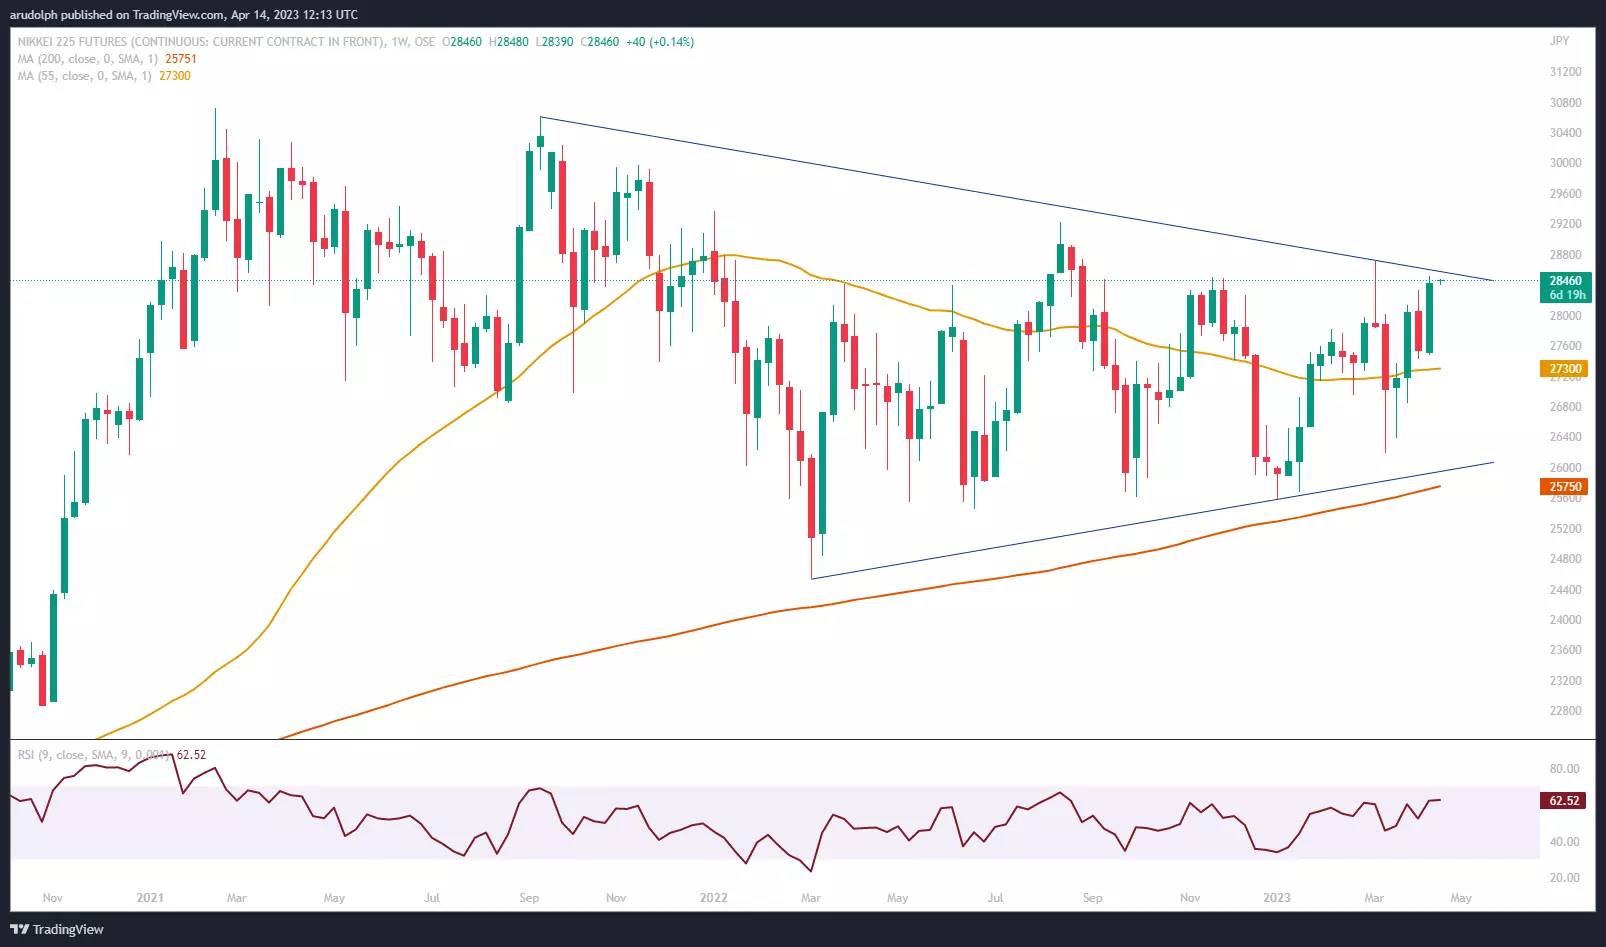
The Nikkei 225 front month futures contract, which has been trading in a sideways trading range since January 2022, seems to be gearing up to overcome its 28,730 March peak, a weekly chart close above which would lead to the January 2022 and August 2022 highs at 29,230 to 29,370 being in focus.
Front month Nikkei 225 weekly chart
On the daily chart the Nikkei 225 has risen for five straight gains but may short-term consolidate around its 2021-to-2023 downtrend line at 28,600, ahead of its 28,730 March peak which remains key for the future contract’s medium-term trend. A rise and daily chart close above this level would point towards the resumption of this year’s uptrend.
Front month Nikkei 225 daily chart
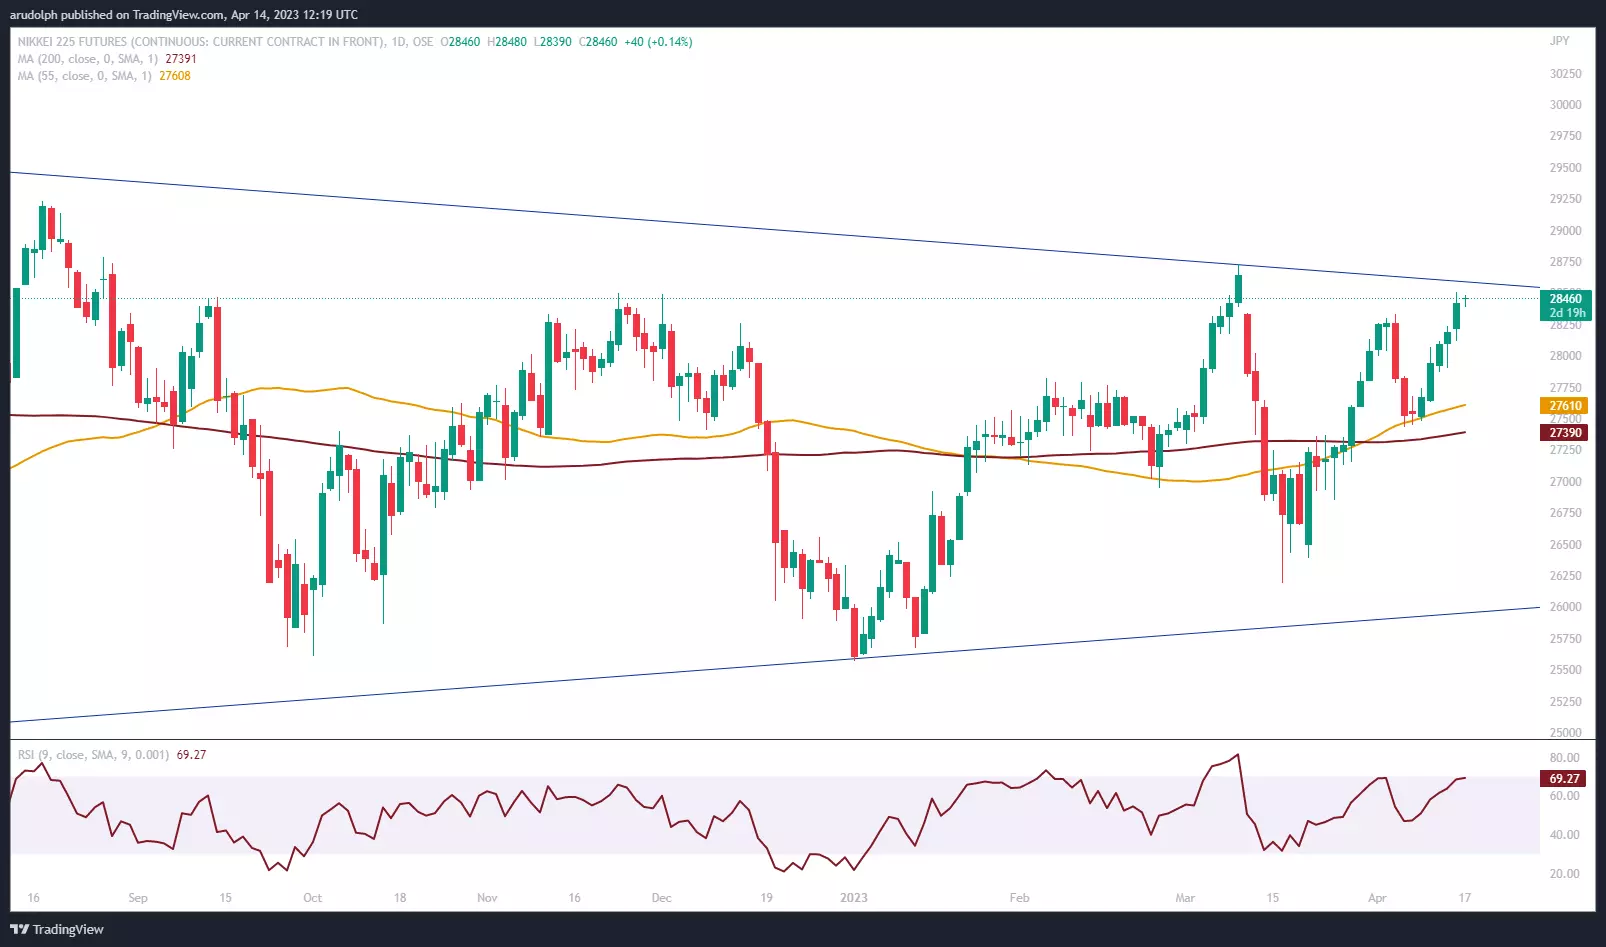
Only a slip through last week’s low and the 200-day simple moving average (SMA) at 27,430 to 27,390 on a daily chart closing basis would put the bullish scenario in doubt.
What about the Hang Seng?
The Hong Kong Hang Seng Index is one of the lagging indices, trading barely up 1.5% year-to-date, with a much less friendly looking chart for the bulls.
Hang Seng daily chart
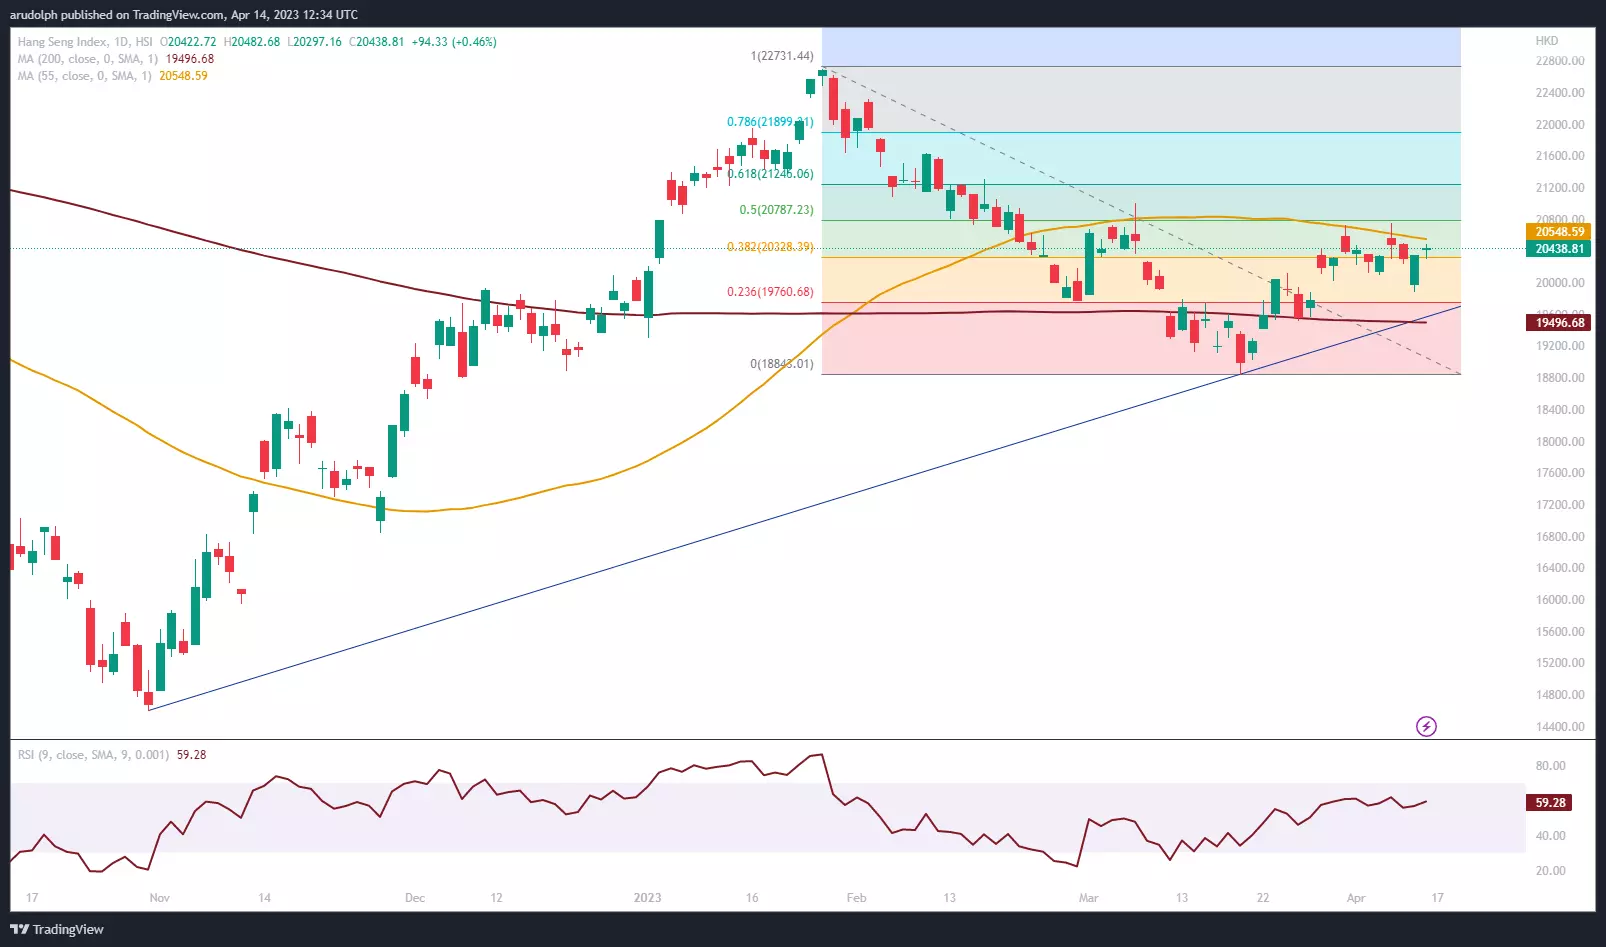
The index so far only managed to retrace 50% of its February-to-April decline and even then has been capped by this level and the early March high at 21,005.66 whilst remaining below its 55-day simple moving average (SMA) at 20,548.59.
The index needs to rise and close on a daily chart closing basis above its early March high at 21,005.66 for it to resume its ascent which began in November of last year.
Over the coming days and weeks the November-to-April support line at 19,590 may act as support, as may the 200-day simple moving average (SMA) at 19,497, but a currently unexpected fall through the 18,829.11 March low would call for further downside being seen.
How do other laggards such as the Dow fare?
The Dow, being barely up 2.7% year-to-date, also has some catching up to do but is looking more perky of last as it is seen to rapidly approach its January-to-February highs at 34,331.47 to 34,342.32, having this week broken out of its December-to-April downtrend channel.
Dow Jones Industrial Average daily chart
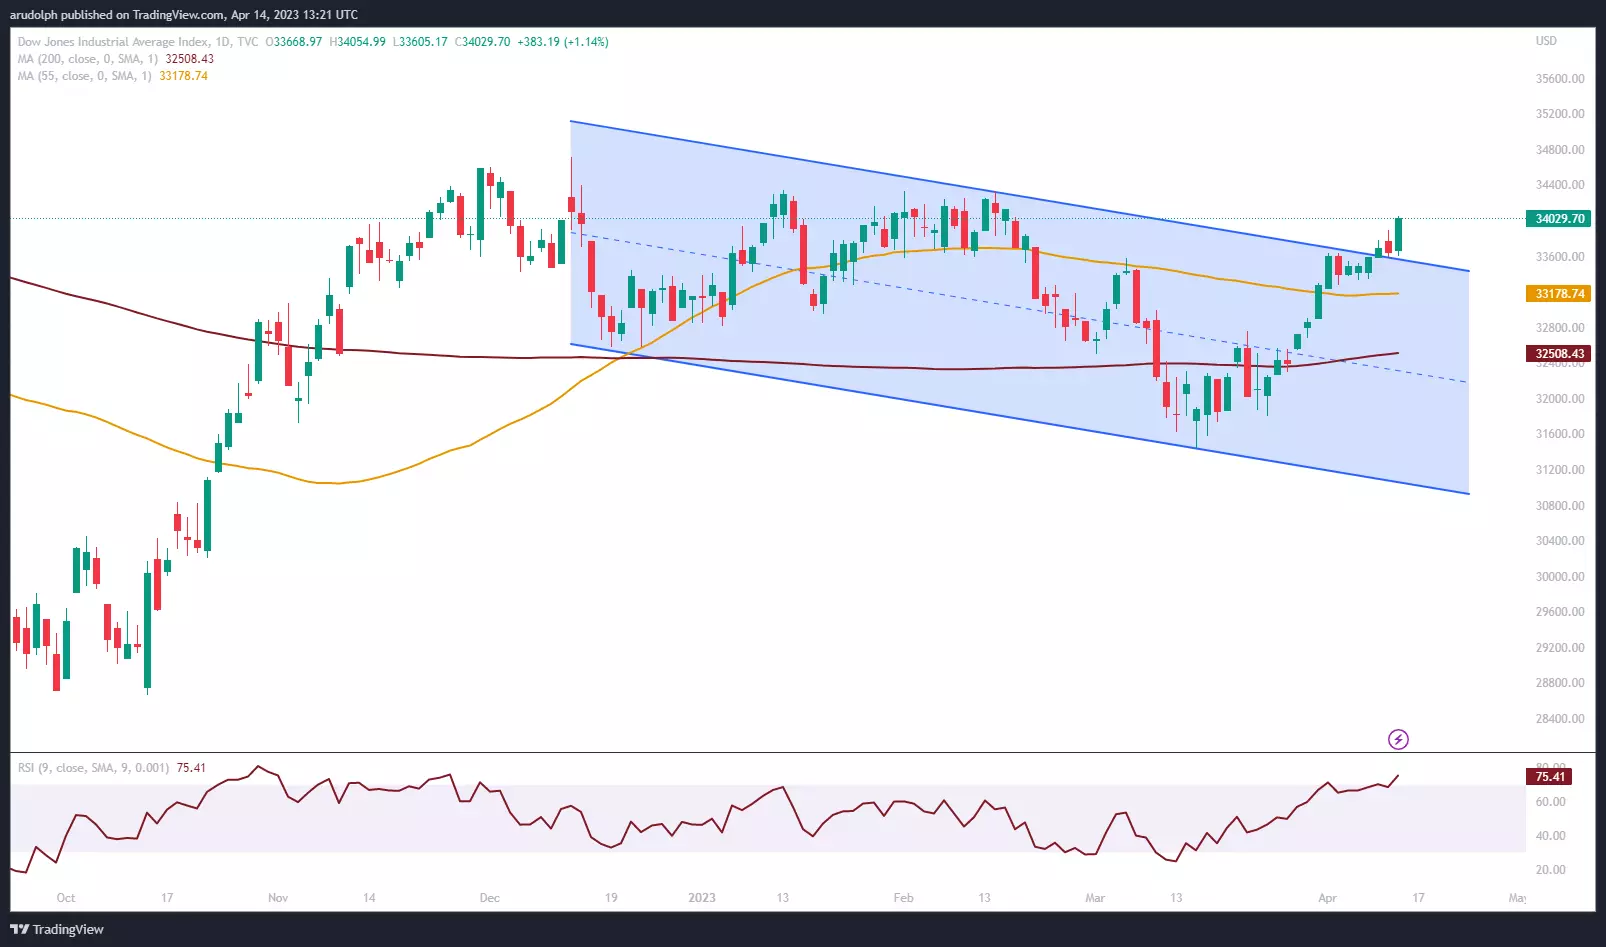
A daily chart close above the 34,342.32 January high would engage the December peak at 34,712.28, an advance above which would put the March and April 2022 highs at 35,372.26 to 35,492.22 on the cards.
Potential support can be seen along the 55-day simple moving average (SMA) at 33,178.74.
What about the Russell 2000?
Another laggard is the Russell 2000 index which is showing a similar performance to the Dow year-to-date and which is displaying a similar chart picture to that of the US banking sector in that it is having difficulties in recovering from its steep February sell-off.
Russell 2000 daily chart
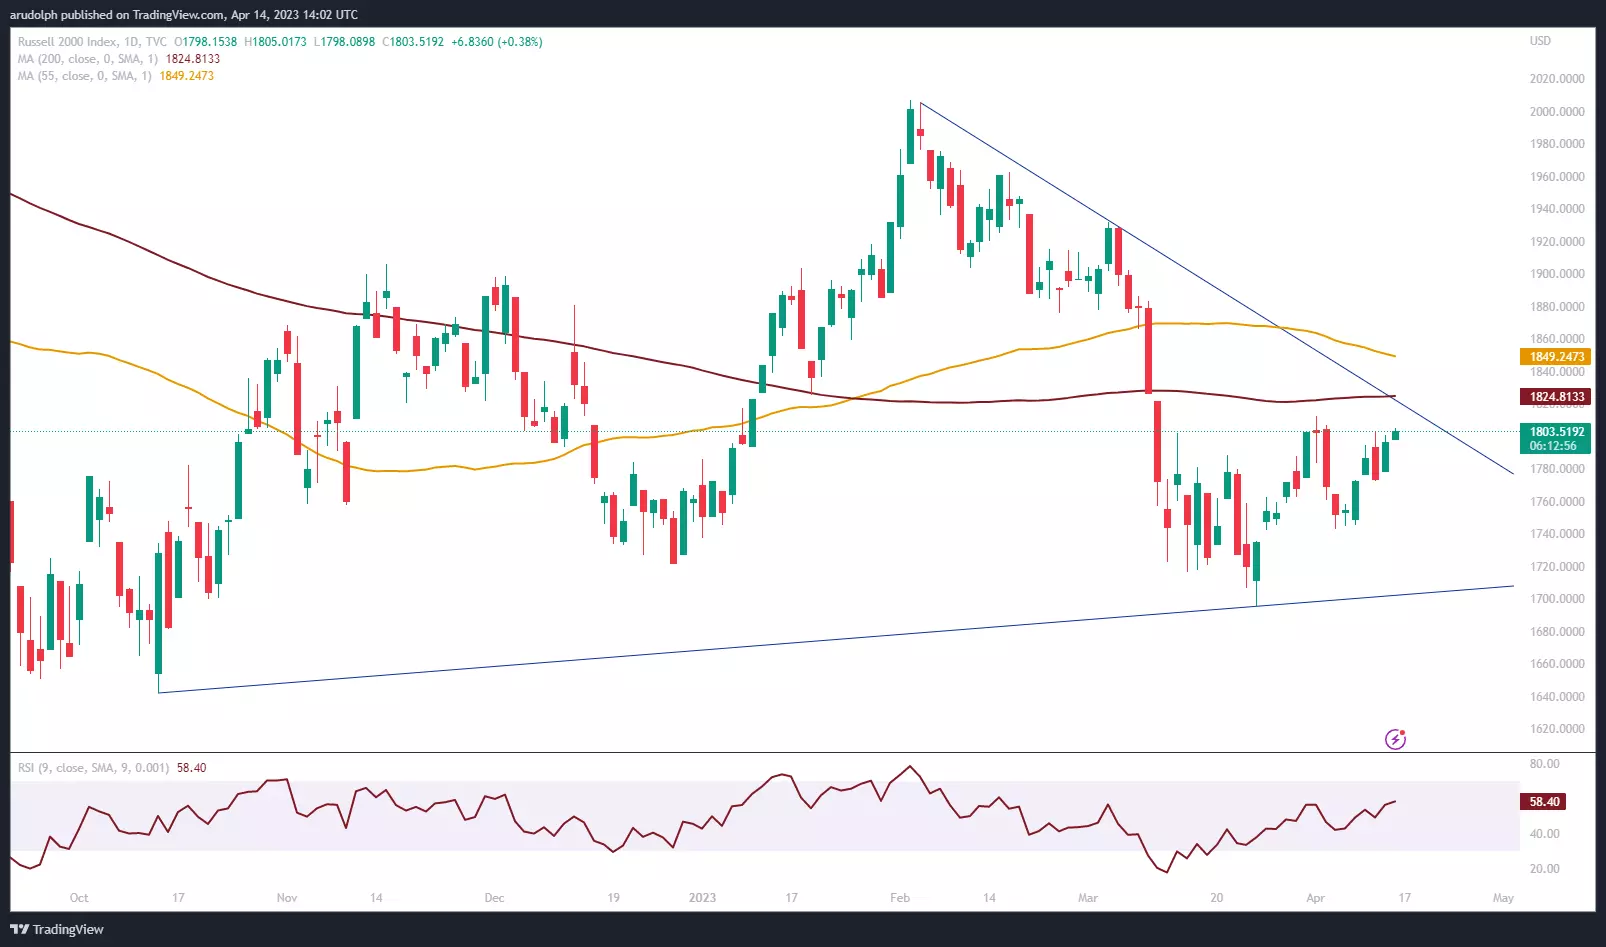
For a bullish reversal to gain traction, a rise and daily chart close above not only the early April high at 1,812.37 but also above the 200-day simple moving average (SMA) at 1,824.79 needs to occur. Only then can a gradual advance back towards the November peak at 1,905.84 begin in earnest.
Although lagging other indices, we expect the Russell 2000 to also have bottomed out from a medium-term perspective at its 1,695.23 March trough.
Unless the current bull market turns into a bear market due to worse-than-expected earnings and economic data pointing towards a global recession, the laggards are unlikely to catch up with the leading indices such as the Nasdaq 100 or CAC 40.
This information has been prepared by IG, a trading name of IG Limited. In addition to the disclaimer below, the material on this page does not contain a record of our trading prices, or an offer of, or solicitation for, a transaction in any financial instrument. IG accepts no responsibility for any use that may be made of these comments and for any consequences that result. No representation or warranty is given as to the accuracy or completeness of this information. Consequently any person acting on it does so entirely at their own risk. Any research provided does not have regard to the specific investment objectives, financial situation and needs of any specific person who may receive it. It has not been prepared in accordance with legal requirements designed to promote the independence of investment research and as such is considered to be a marketing communication. Although we are not specifically constrained from dealing ahead of our recommendations we do not seek to take advantage of them before they are provided to our clients.
CFDs are a leveraged products. CFD trading may not be suitable for everyone and can result in losses that exceed your initial deposit, so please ensure that you fully understand the risks involved.

Seize your opportunity
Deal on the world’s stock indices today.
- Trade on rising or falling markets
- Get one-point spreads on the FTSE 100
- Unrivalled 24-hour pricing
See opportunity on an index?
Try a risk-free trade in your demo account, and see whether you’re on to something.
- Log in to your demo
- Try a risk-free trade
- See whether your hunch pays off
See opportunity on an index?
Don’t miss your chance – upgrade to a live account to take advantage.
- Get spreads from one point on the FTSE 100
- Trade more 24-hour indices than any other provider
- Analyse and deal seamlessly on smart, fast charts
See opportunity on an index?
Don’t miss your chance. Log in to take your position.
Live prices on most popular markets
- Forex
- Shares
- Indices
Prices above are subject to our website terms and agreements. Prices are indicative only. All shares prices are delayed by at least 15 mins.
