Now that most major central banks have made their rate decisions where to next for the FTSE 100, DAX 40 and Euro Stoxx 50?
The ECB’s hike to 4.0%, Fed’s hawkish pause and BoE’s dovish stance put pressure on stocks except the FTSE 100.


Macro picture now that ECB, Fed and BoE have announced their monetary policies
Last week the European central Bank (ECB) hiked its deposit facility for a tenth consecutive time to 4.00%, to the highest level since the euro was introduced. The central bank did, however, indicate that a peak might now have been reached in its hiking cycle but that a cut in its rates is not expected until at least July of next year.
EUR/USD slid to its late May low and this week even briefly to a six-month low around the $1.0600 mark while the DAX 40 and Euro Stoxx 50 indices are on track for a negative week.
Following the US Federal Reserve’s (Fed) hawkish pause in which it did not hike its rates but left the door open for one more rate hike, the US dollar benefitted and is on track for its tenth straight week of gains as US yields hit multi-year highs. Such a hike would be the twelfth in a row, to between 5.50% to 5.75% for the fed funds rate with rates now not expected to be cut before the end of the summer of 2024.
The Bank of England (BoE) earlier today surprised some market participants by keeping its rates on hold at 5.25%. It was a close vote, though, with five monetary policy committee members wanting to keep rates steady but four opting for a hike. Their decision was probably influenced by softer-than-expected August inflation in the UK with especially the core consumer price index (CPI), excluding volatile energy and food costs, coming in at 6.2% versus 6.9% in July.
Since the UK central bank used the word 'sufficiently restrictive' in its statement it looks like they stand by their first quarter (Q1) stance of inflation heading lower fast and thus no more rate hikes might be on the horizon.
The British pound continues to slide and trades in six-month lows but the FTSE 100 is buoyed by the announcement.
FTSE 100 technical forecast
Last week the FTSE 100 rose by over 2% - one of its strongest weeks this year - and did so as a rapidly rising oil price and rallying mining stocks boosted the blue-chip index.
It seems to be the only European stock index which might be on track for its second weekly gain in a row as it is trying to overcome its 2023 downtrend line, July peak and 23.6% Fibonacci retracement of its October 2022 to February 2023 rally.
FTSE 100 weekly candlestick chart
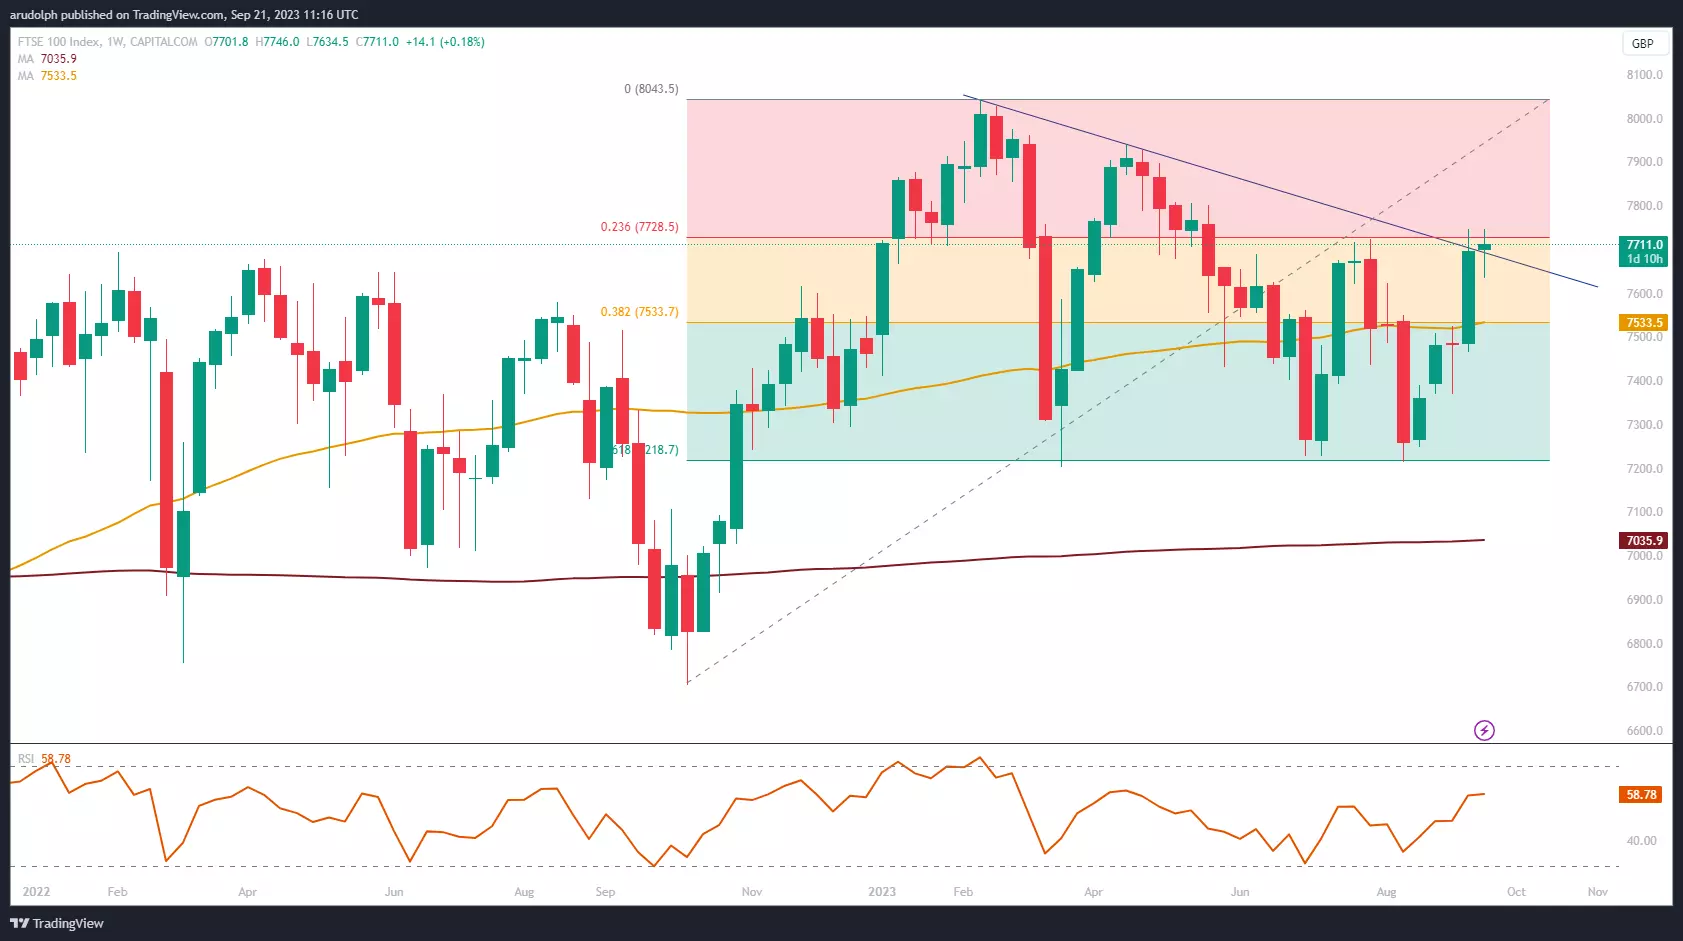
A weekly chart close this Friday above the July peak and 23.6% Fibonacci retracement at 7,223.20 to 7,228.50 could extend all the way to the February and April highs at 7,938.3 to 8,044.4.
If the current key resistance zone were to cap, a slide back towards the 38.2% Fibonacci retracement and the 55-day simple moving average (SMA) at 7,533.70 may ensue.
As long as the 61.8% Fibonacci retracement at 7,218.7 holds, though, as it did in March, July and August of this year, the FTSE 100 remains in a long-term sideways trading range.
DAX 40 technical forecast
The DAX index is heading down towards its 15,468.65 to 15,419.25 major support zone. It consists of the July and August lows as well as the 23.6% Fibonacci retracement of the September 2022 to July 2023 advance.
DAX 40 weekly candlestick chart
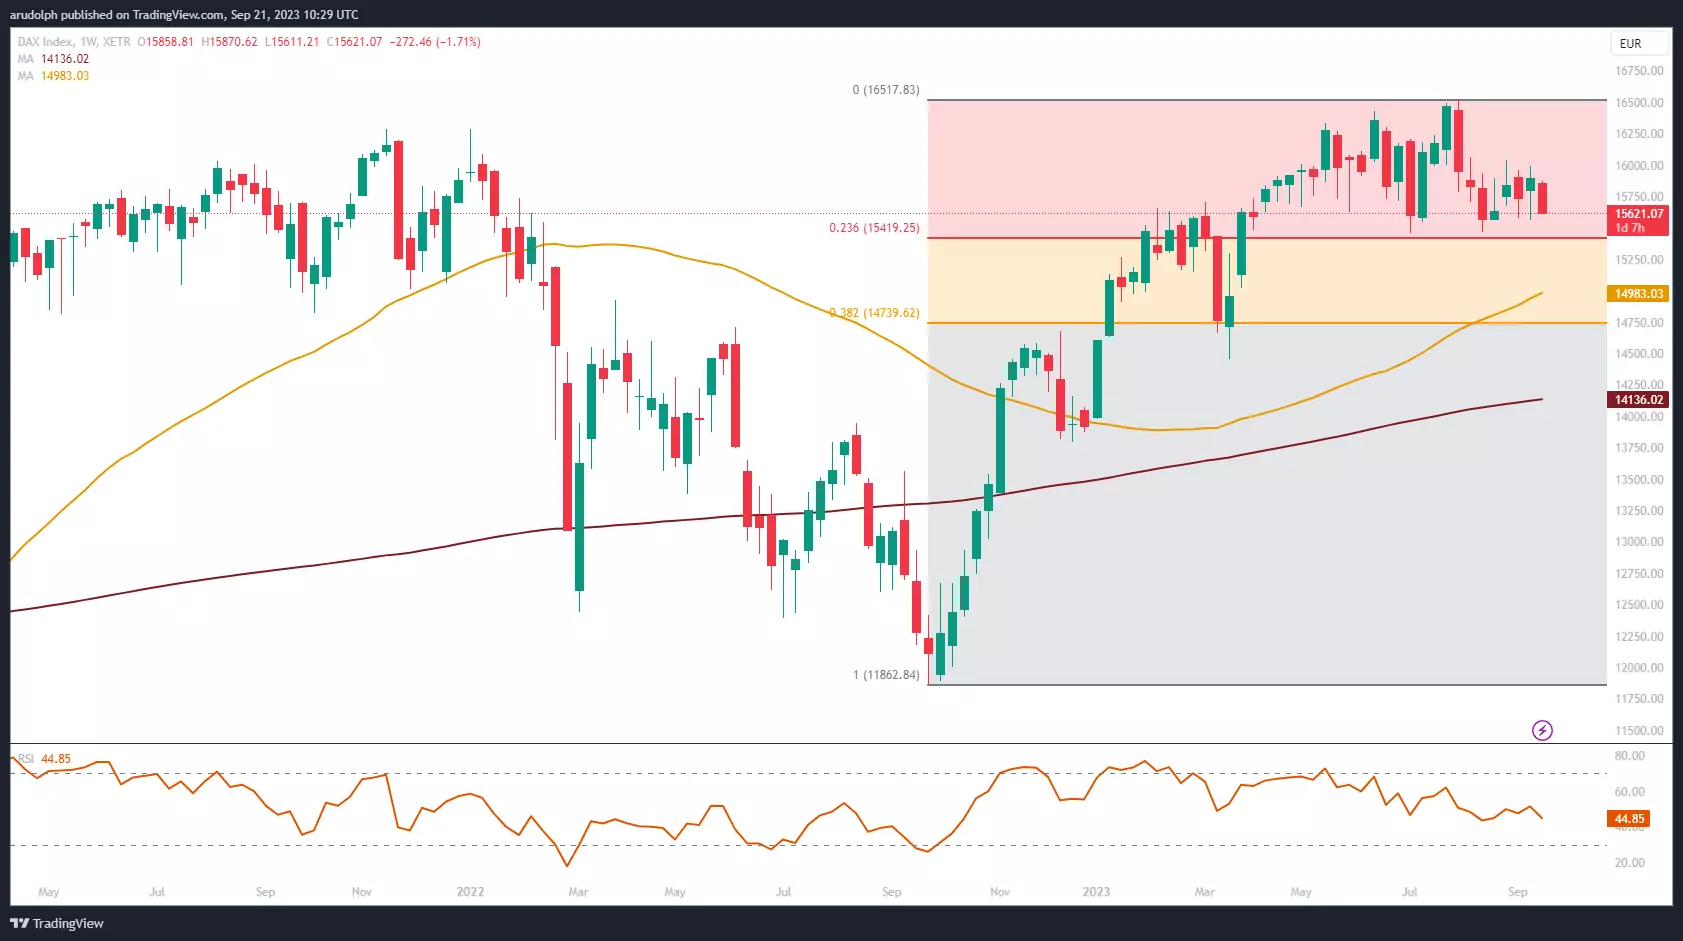
Since from a seasonal point of view the last couple of weeks of September and October often incur a rise in volatility and falling stock prices, it is possible that the above-mentioned significant support area might be fallen through.
A fundamental reason for this may be the worry that rates will stay higher for longer and that recurring inflationary pressures due to the high oil price may lead to a slowdown in growth, not just in Germany - which is already in a recession - but the Eurozone as well.
If so, the area between the 55-day SMA, May-to-December 2021 lows could be reached, together with the 38.2% Fibonacci retracement at 14,982.68 to 14,739.62.
As long as the March low at 14,458.39 underpins, the longer-term uptrend would nonetheless remain intact.
Euro Stoxx 50 technical outlook
The story for the Euro Stoxx 50 index is quite similar to that of the DAX 40 in that it has been trading in a sideways range since April of this year and stays close to its June-to-September key support zone at 4,210.69 to 4,175.37.
Euro Stoxx 50 weekly candlestick chart
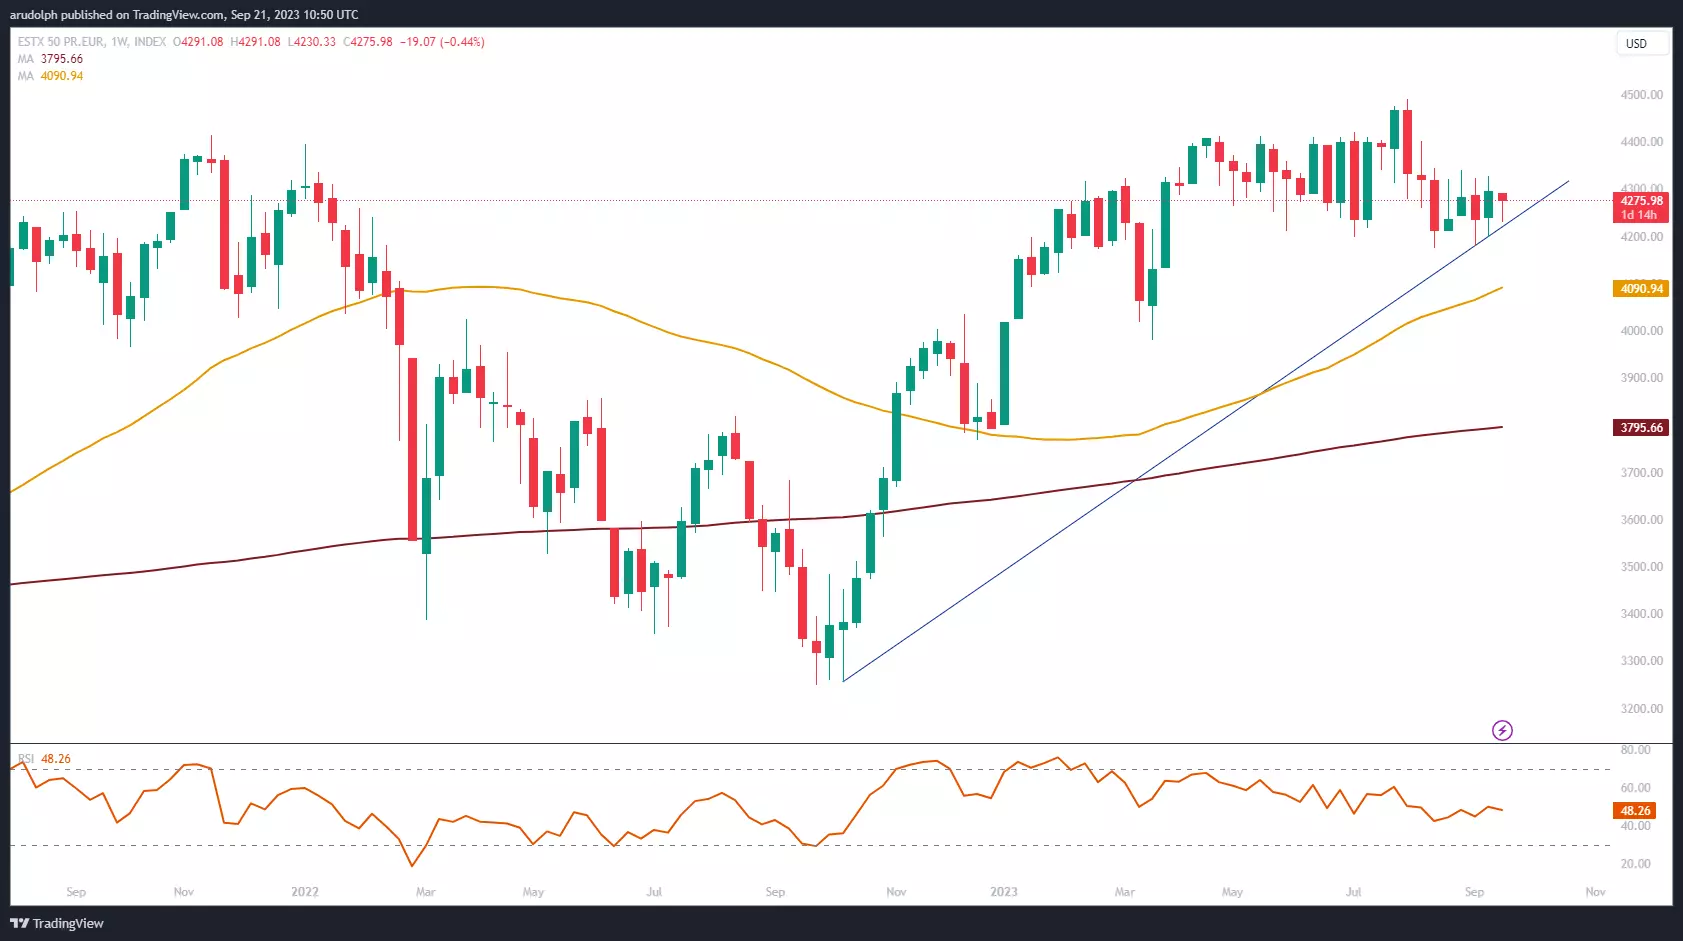
Were this support area to give way, the 55-day SMA at 4,090.94 might be revisited and perhaps also the November-to-January lows at 4,046.69 to 4,027.43.
As long as the next lower March low at 3,980.94 holds, however, the long-term uptrend remains valid.
This information has been prepared by IG, a trading name of IG Limited. In addition to the disclaimer below, the material on this page does not contain a record of our trading prices, or an offer of, or solicitation for, a transaction in any financial instrument. IG accepts no responsibility for any use that may be made of these comments and for any consequences that result. No representation or warranty is given as to the accuracy or completeness of this information. Consequently any person acting on it does so entirely at their own risk. Any research provided does not have regard to the specific investment objectives, financial situation and needs of any specific person who may receive it. It has not been prepared in accordance with legal requirements designed to promote the independence of investment research and as such is considered to be a marketing communication. Although we are not specifically constrained from dealing ahead of our recommendations we do not seek to take advantage of them before they are provided to our clients.
CFDs are a leveraged products. CFD trading may not be suitable for everyone and can result in losses that exceed your initial deposit, so please ensure that you fully understand the risks involved.

Seize your opportunity
Deal on the world’s stock indices today.
- Trade on rising or falling markets
- Get one-point spreads on the FTSE 100
- Unrivalled 24-hour pricing
See opportunity on an index?
Try a risk-free trade in your demo account, and see whether you’re on to something.
- Log in to your demo
- Try a risk-free trade
- See whether your hunch pays off
See opportunity on an index?
Don’t miss your chance – upgrade to a live account to take advantage.
- Get spreads from one point on the FTSE 100
- Trade more 24-hour indices than any other provider
- Analyse and deal seamlessly on smart, fast charts
See opportunity on an index?
Don’t miss your chance. Log in to take your position.
Live prices on most popular markets
- Forex
- Shares
- Indices
Prices above are subject to our website terms and agreements. Prices are indicative only. All shares prices are delayed by at least 15 mins.
