EUR/USD, GBP/USD and AUD/USD bullish ahead of US inflation print
Outlook on EUR/USD, GBP/USD and AUD/USD ahead of US CPI and PPI data releases.


EUR/USD rises ahead of US inflation print
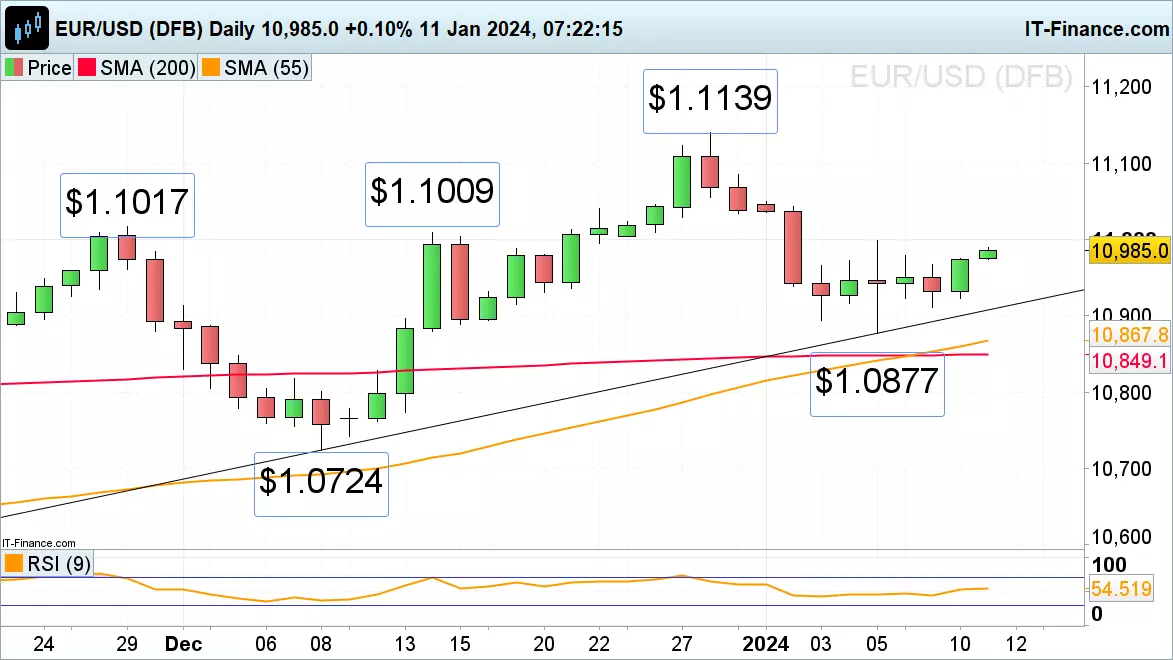
EUR/USD’s bullish reversal off last week’s low at $1.0877 post US Non-Farm Payrolls seems to have legs with last week’s high at $1.0998 now being within reach ahead of today’s US Consumer Price Index (CPI) release. The rise in the cross seems to be attributed to US dollar weakness rather than euro strength as the eurozone faces a possible recession as it had a slight slowdown in third quarter (Q3) and indicators point towards a potential contraction in December.
Above $1.0998 lie the November and mid-December highs at $1.1009 to $1.1017 which are likely to act as resistance.
Minor support can be spotted around the 2 January low at $1.0939 with further minor support being seen at last Thursday’s $1.0916 low ahead of the recent $1.0894 to $1.0877 lows.
GBP/USD probes minor resistance
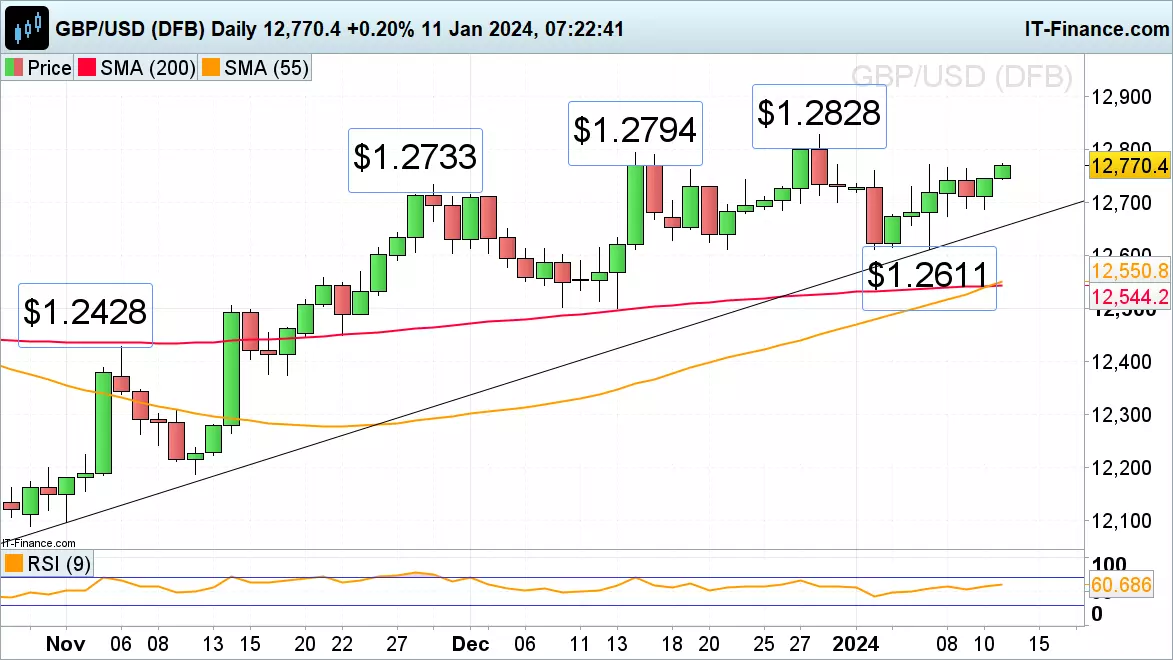
GBP/USD’s bullish reversal from its two-week low at $1.2611, seen last week amid the publication of US Non-Farm Payrolls, has taken it to last week’s $1.2771 high.
Above this level beckon the mid-December high at $1.2794 and the December five-month peak at $1.2828.
Upside pressure should dominate while Wednesday’s low at $1.2687 underpins. Above it minor support can be found at Wednesday’s $1.2745 high and below it lie the November-to-January uptrend line, 21 December and current January lows at $1.2656 to $1.2611.
AUD/USD continues to range trade above last week’s low
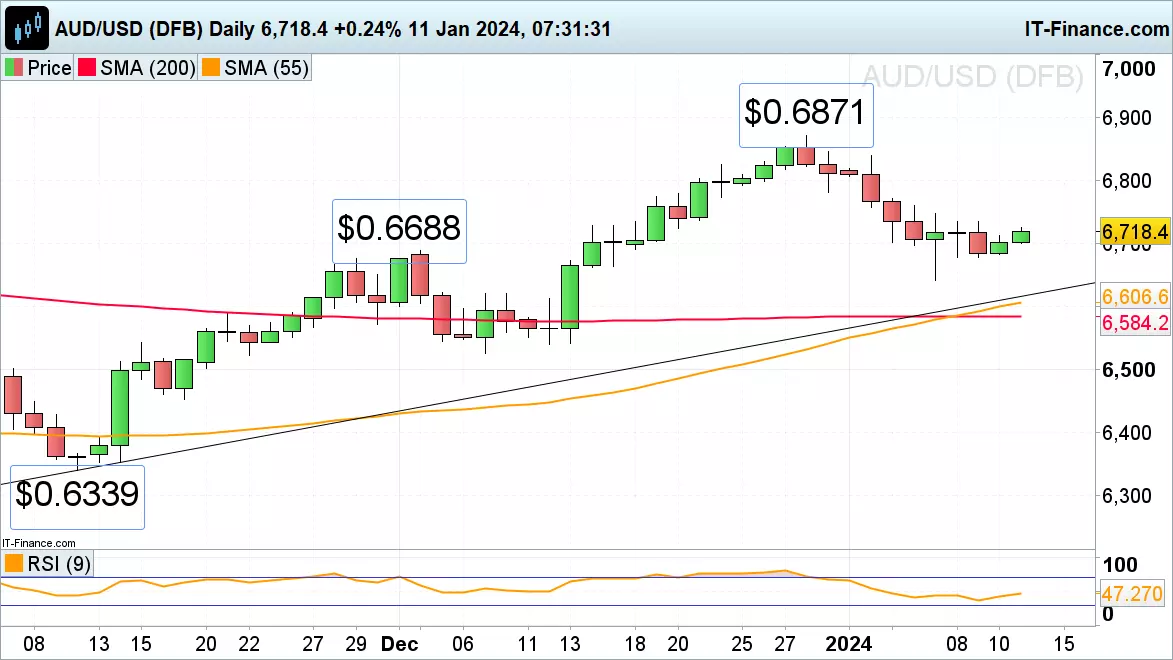
AUD/USD’s slide from its five-month December peak at $0.6871 to last week’s $0.6641 low amid a falling gold price has been followed by sideways trading despite Australia’s trade surplus beating estimates.
Minor resistance sits at Monday’s $0.6734 high, above which lies at Friday’s $0.6748 high which needs to be exceeded for at least a minor bullish reversal to become possible.
While $0.6748 isn’t overcome, overall downside pressure is likely to retain the upper hand with a fall through $0.6641 possibly leading to the October-to-January uptrend line and the 200- and 55-day simple moving averages (SMA) at $0.6616 to $0.6584 being reached.
This information has been prepared by IG, a trading name of IG Limited. In addition to the disclaimer below, the material on this page does not contain a record of our trading prices, or an offer of, or solicitation for, a transaction in any financial instrument. IG accepts no responsibility for any use that may be made of these comments and for any consequences that result. No representation or warranty is given as to the accuracy or completeness of this information. Consequently any person acting on it does so entirely at their own risk. Any research provided does not have regard to the specific investment objectives, financial situation and needs of any specific person who may receive it. It has not been prepared in accordance with legal requirements designed to promote the independence of investment research and as such is considered to be a marketing communication. Although we are not specifically constrained from dealing ahead of our recommendations we do not seek to take advantage of them before they are provided to our clients.
CFDs are a leveraged products. CFD trading may not be suitable for everyone and can result in losses that exceed your initial deposit, so please ensure that you fully understand the risks involved.

Start trading forex today
Find opportunity on the world’s most-traded – and most-volatile – financial market
- Trade spreads from just 0.6 points on EUR/USD
- Analyse with clear, fast charts
- Speculate wherever you are with our intuitive mobile apps
See an FX opportunity?
Try a risk-free trade in your demo account, and see whether you’re onto something.
- Log in to your demo
- Try a risk-free trade
- See whether your hunch pays off
See an FX opportunity?
Don’t miss your chance – upgrade to a live account to take advantage.
- Get spreads from just 0.6 points on popular pairs
- Analyse and deal seamlessly on fast, intuitive charts
- See and react to breaking news in-platform
See an FX opportunity?
Don’t miss your chance. Log in to take your position.
Live prices on most popular markets
- Forex
- Shares
- Indices
Prices above are subject to our website terms and agreements. Prices are indicative only. All shares prices are delayed by at least 15 mins.
