FTSE 100: Where to next for Barclays, HSBC, Lloyds and NatWest share prices?
What to expect and how to trade UK banks’ upcoming results.

UK bank earnings loom
Lloyds, Barclays, NatWest Group, Standard Chartered, and HSBC are all set to release their second-quarter figures in the coming days. Lloyds and HSBC may see upgrades to net interest income and return on tangible equity due to their low existing guidance. NatWest’ s current income guidance is above the City consensus, and there is a potential for a miss on costs after higher levels were forecasted in the first half.
Declining balance sheets a risk
The major focus of this reporting season will be declining balance sheets. Deposits in the UK are falling faster than loans, which puts pressure on banks to adjust their balance sheets to maintain liquidity levels. The spreads on deposits are also higher than on loans, meaning that larger declines in deposits are leading to larger movements in net interest income.
On the positive side, lower balance sheet growth requires less capital, which should benefit capital distributions to shareholders. Currently, UK banks are yielding 15%, including dividends and share buybacks. Although Lloyds is likely to increase its net interest margin guidance, 150 basis points (bp) of interest rate hikes since the first quarter are unlikely to provide any further benefit.
Mixed year-to-date performance for UK banks
HSBC has outperformed the market this year with a 20% rise. Despite this, it still trades at a significant discount to its own historical valuations. Barclays is the only other bank to have outperformed the FTSE 100, with NatWest the weakest performer for the year so far.
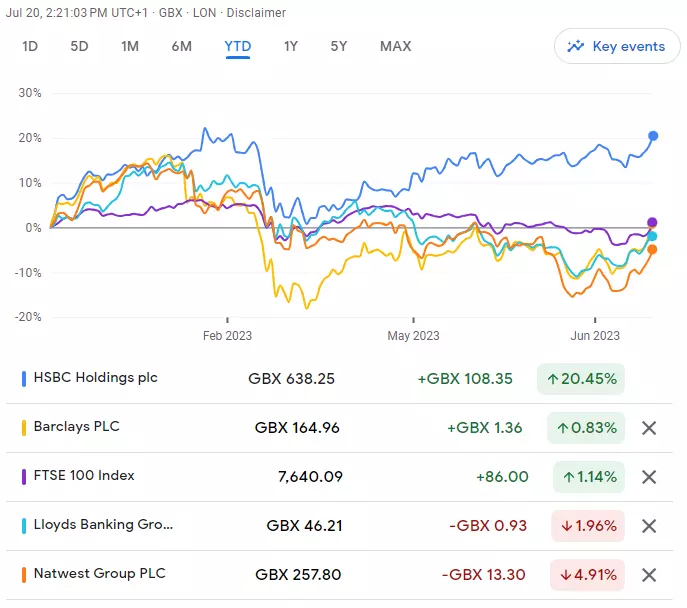
Except for HSBC, most UK banks have had a bad year-to-date and are even underperforming this year’s global worst performing major stock index, the FTSE 100 (of which they are all constituents) which is only just creeping back into positive territory.
When are Barclays, HSBC, Lloyds and NatWest’s results expected and what are the expectations?
Second quarter (Q2) 2023 results are on:
26 July: Lloyds
Revenue of £4.583 billion : +5.6% year on year (YoY) and Earnings per share (EPS): 1.85p (-18.1% YoY)
27 July: Barclays
Revenue of £6.572 billion : -2.0% year on year (YoY) and Earnings per share (EPS): 8.34p (+1.1% YoY)
28 July: NatWest
Revenue of £3.670 billion : +14.3% year on year (YoY) and Earnings per share (EPS): 11.04p (-15.4% YoY)
1 August: HSBC
Revenue of £16.035 billion : +22.0% year on year (YoY) and Earnings per share (EPS): 31p (+63.2% YoY)
Analyst ratings, P/Es and dividend yields for Barclays, Lloyds, HSBC and NatWest shares:
Only the Barclays share price is mirroring the blue-chip index with the Lloyds and NatWest share prices so far remaining in negative territory but the HSBC share price greatly outperforming.
This may soon be about to change, though, as both analyst recommendations and the technical picture are improving for its competitors as well.
Refinitiv data shows a consensus analyst rating of ‘buy’ for Barclays (3 strong buy, 10 buy, 5 hold but also 2 sell) with the median of estimates suggesting a long-term price target of 235.00 pence, roughly 42% above current levels (as of 20/07/2023).
Looking closer at the numbers, according to Refinitiv Eikon Barclays currently has a P/E ratio of 5.52 and dividend yield of 4.41% which compares to HSBC’s P/E of 10.97 and 4.84%, Lloyds’ 6.48 and 5.14% and NatWest’s 7.18 and 5.29%.
Lloyds is also rated as a ‘buy’ by analysts (4 strong buy, 8 buy, 6 hold but also 3 sell) with a median of estimates suggesting a long-term price target of 61.00 pence, approximately 32% above current levels.
So is NatWest with 4 strong buy, 11 buy, 4 hold but 2 sell with a median of estimates suggesting a long-term price target of 360.00 pence, roughly 39% above current levels, and HSBC with 4 strong buy, 9 buy and 7 hold and a median long-term price target of 765.00 pence, about 20% above current levels.
Technical outlook on Barclays, Lloyds, HSBC and NatWest shares
Barclays share price daily candlestick chart
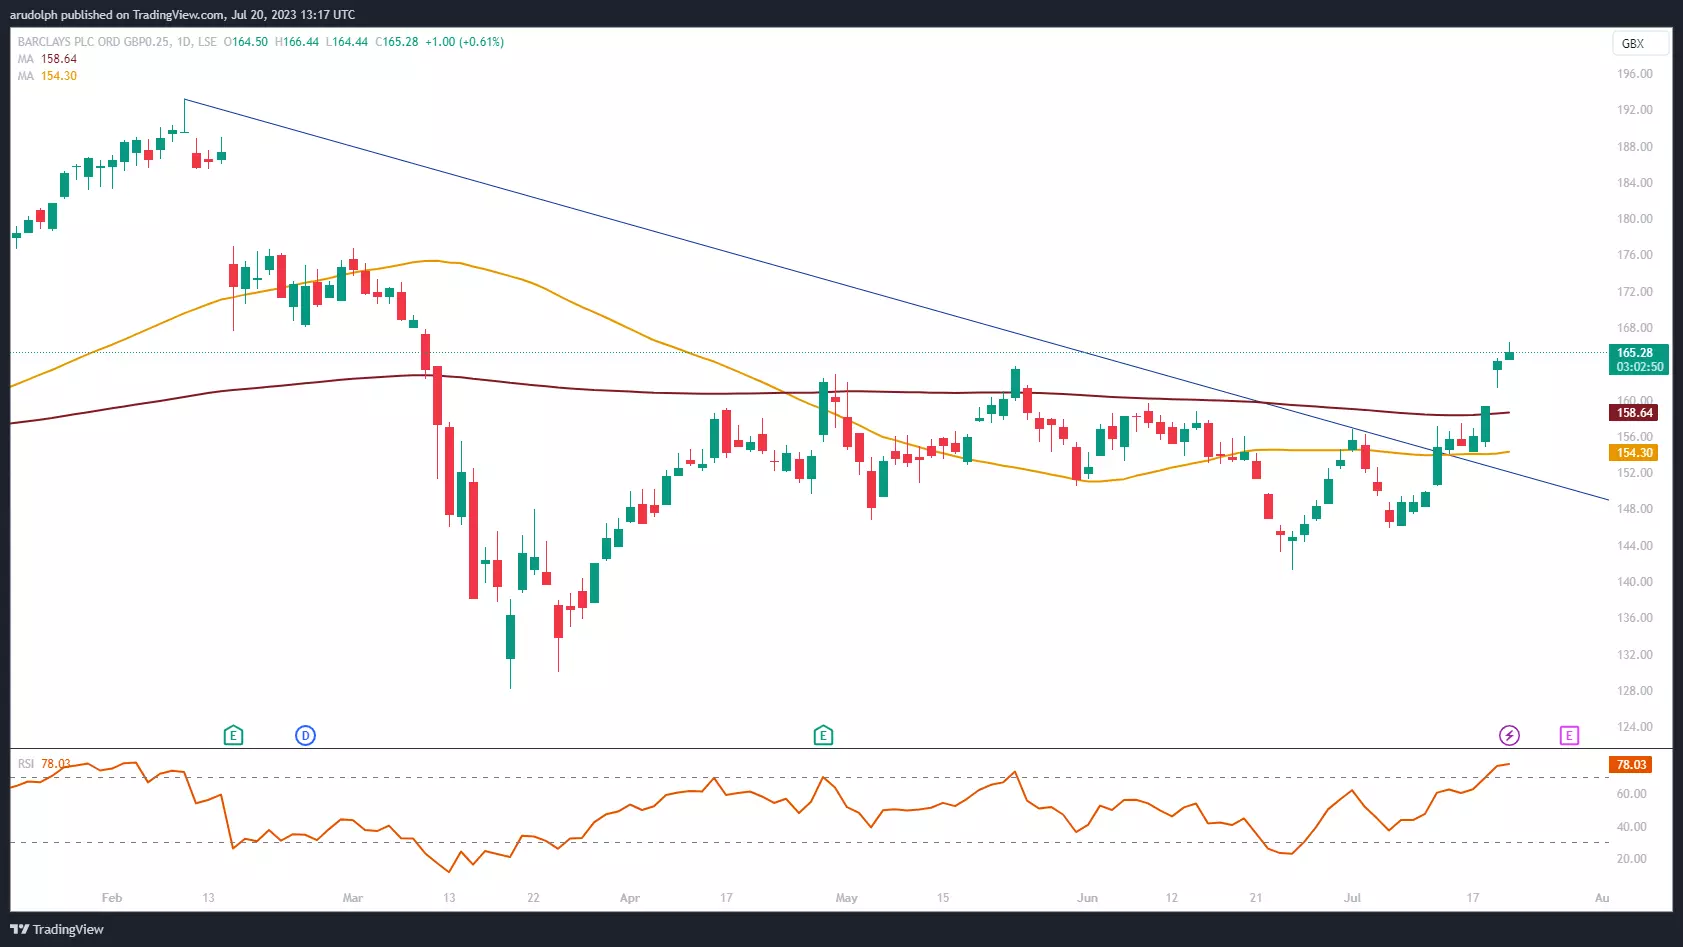
The rise and daily chart close above the April and May highs at 162.88p to 163.76p this week has confirmed a bullish reversal pattern with the February price gap at 176.98p to 186.00p being eyed, as well as the February peak at 193.18p.
The next higher psychological 200p region also remains in sight.
The bullish reversal pattern in the Barclays share price will remain valid as long as it stays above its 141.26 June low.
Lloyds share price daily candlestick chart
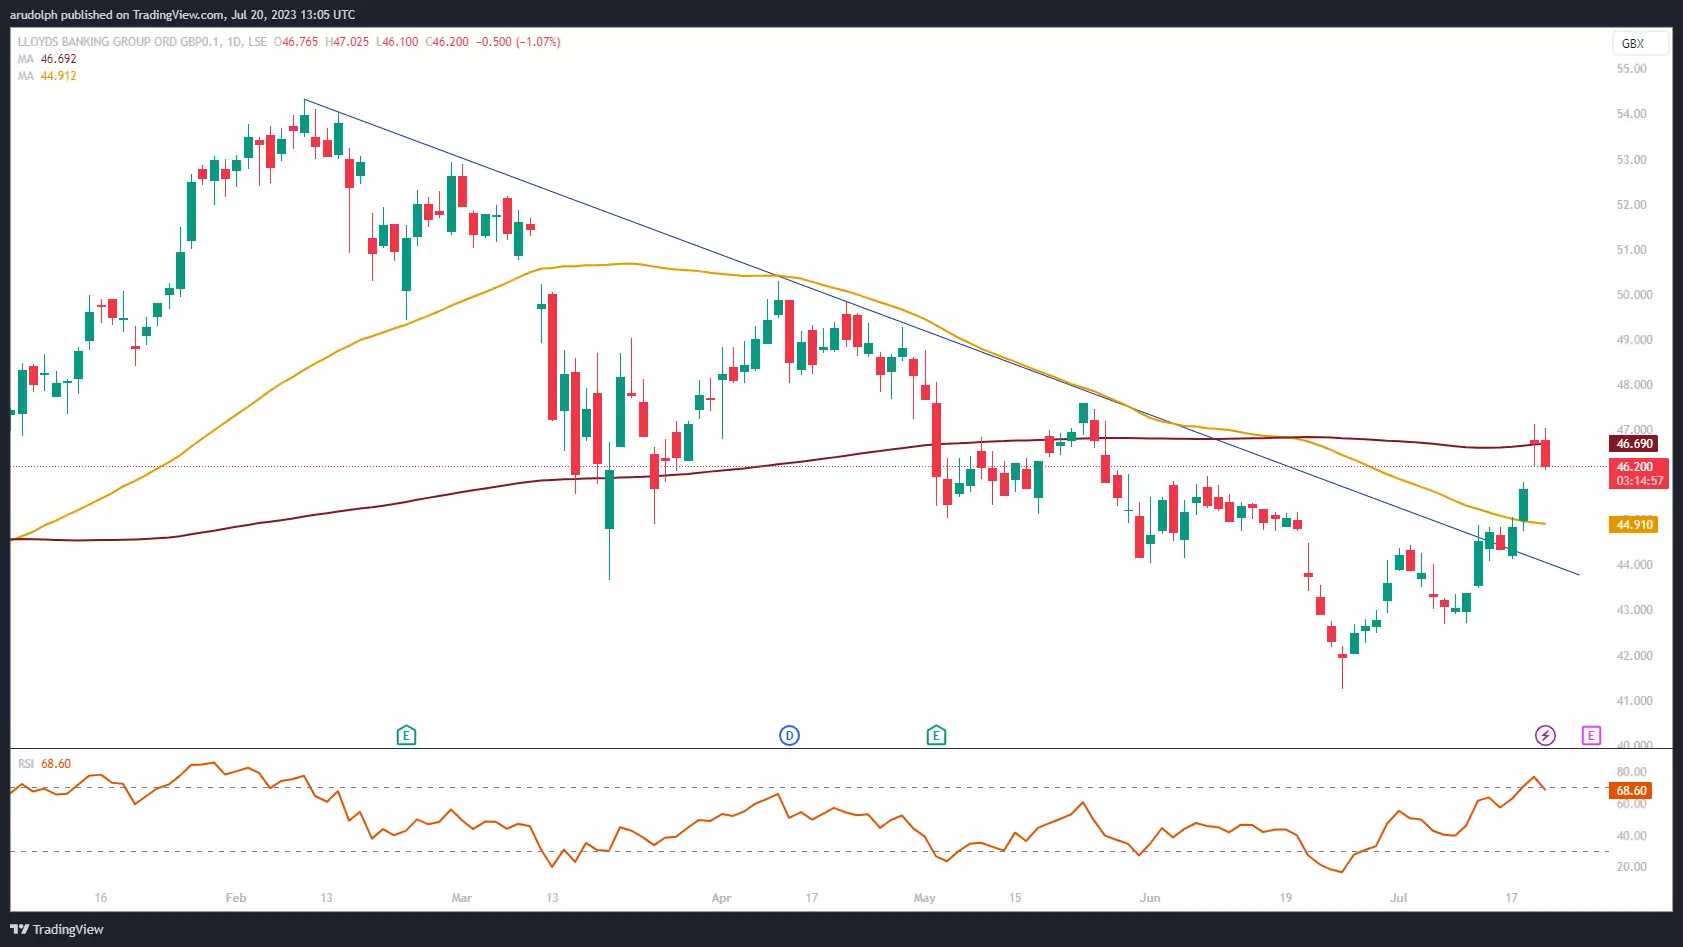
The Lloyds share price is currently grappling with its 200-day simple moving average (SMA) at 46.69p which needs to be overcome, together with the late-May high at 47.59p on a daily chart closing basis, for a medium-term bullish reversal to gain traction.
If indeed a bullish turn-around is taking place, the April peak at 50.30p would represent the next upside target, followed by the February high at 54.33p.
Since the February-to-July downtrend line has been broken through, we believe that a medium-term bottom has been formed since the 41.24p June low.
While it doesn’t give way, a recovery scenario in the Lloyds share price looks probable.
HSBC share price daily candlestick chart
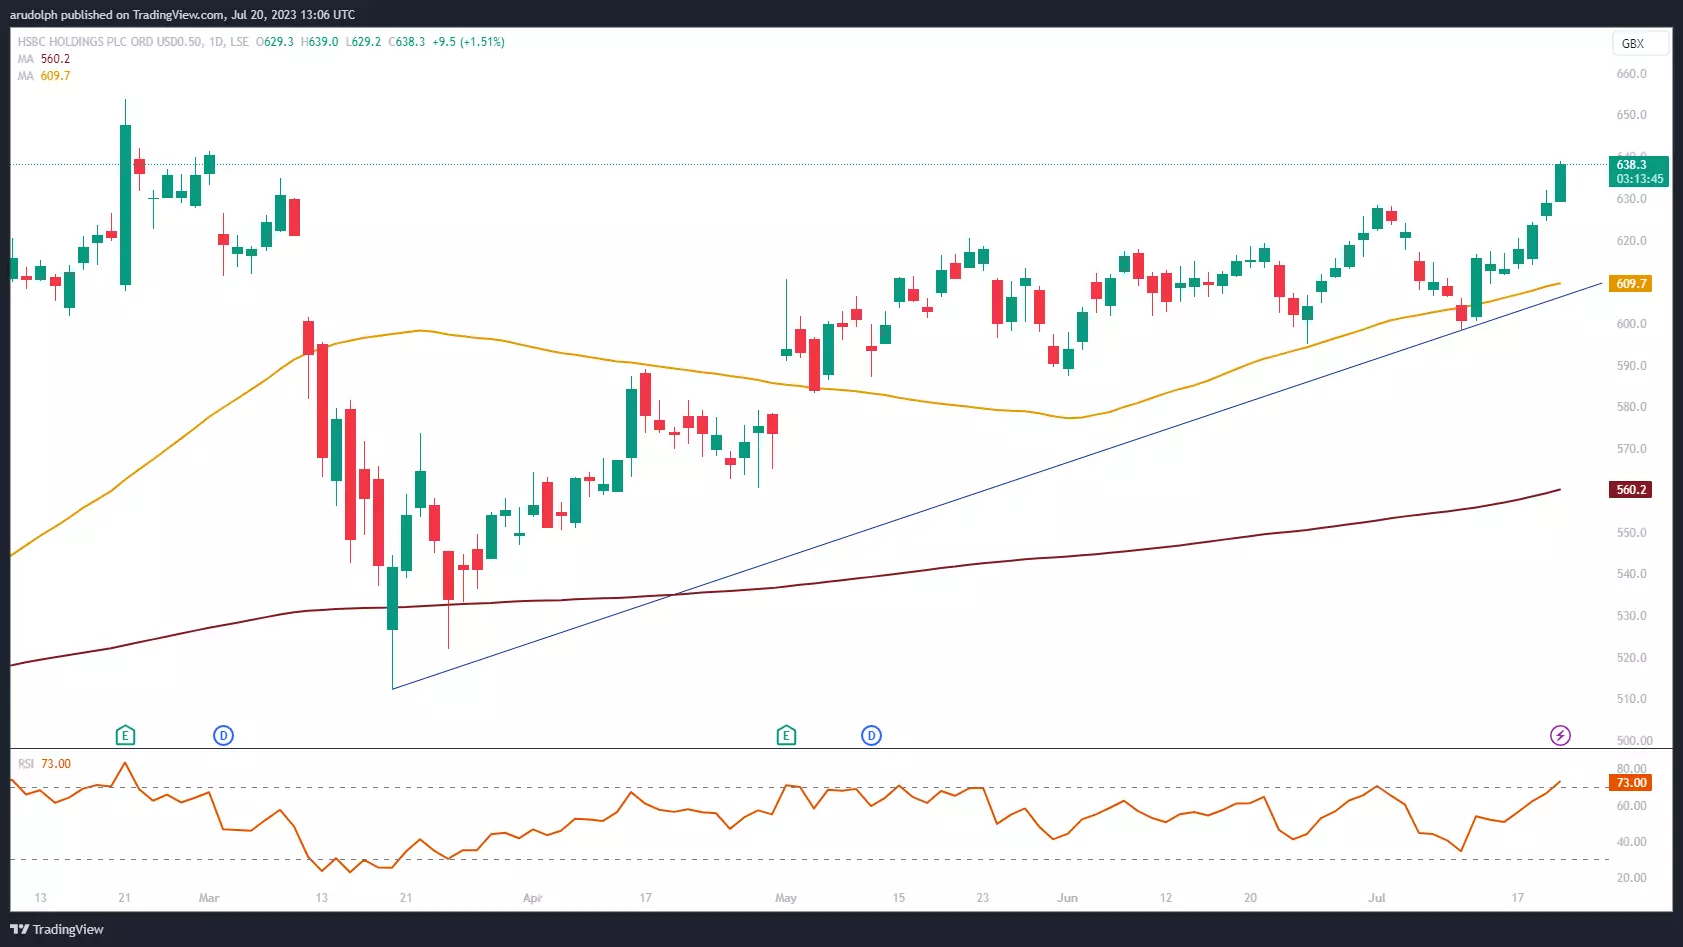
The HSBC share price continues its steady advance from its March 512.3p low towards its February peak at 653.8p. A rise above this level would push the psychological 700p mark to the fore.
Given that the HSBC share price has risen for the past seven consecutive days and has left its May-to-July sideways trading range, the February peak is expected to be reached within days.
Overall upside momentum should prevail while the June trough at 587.4p underpins.
NatWest share price daily candlestick chart
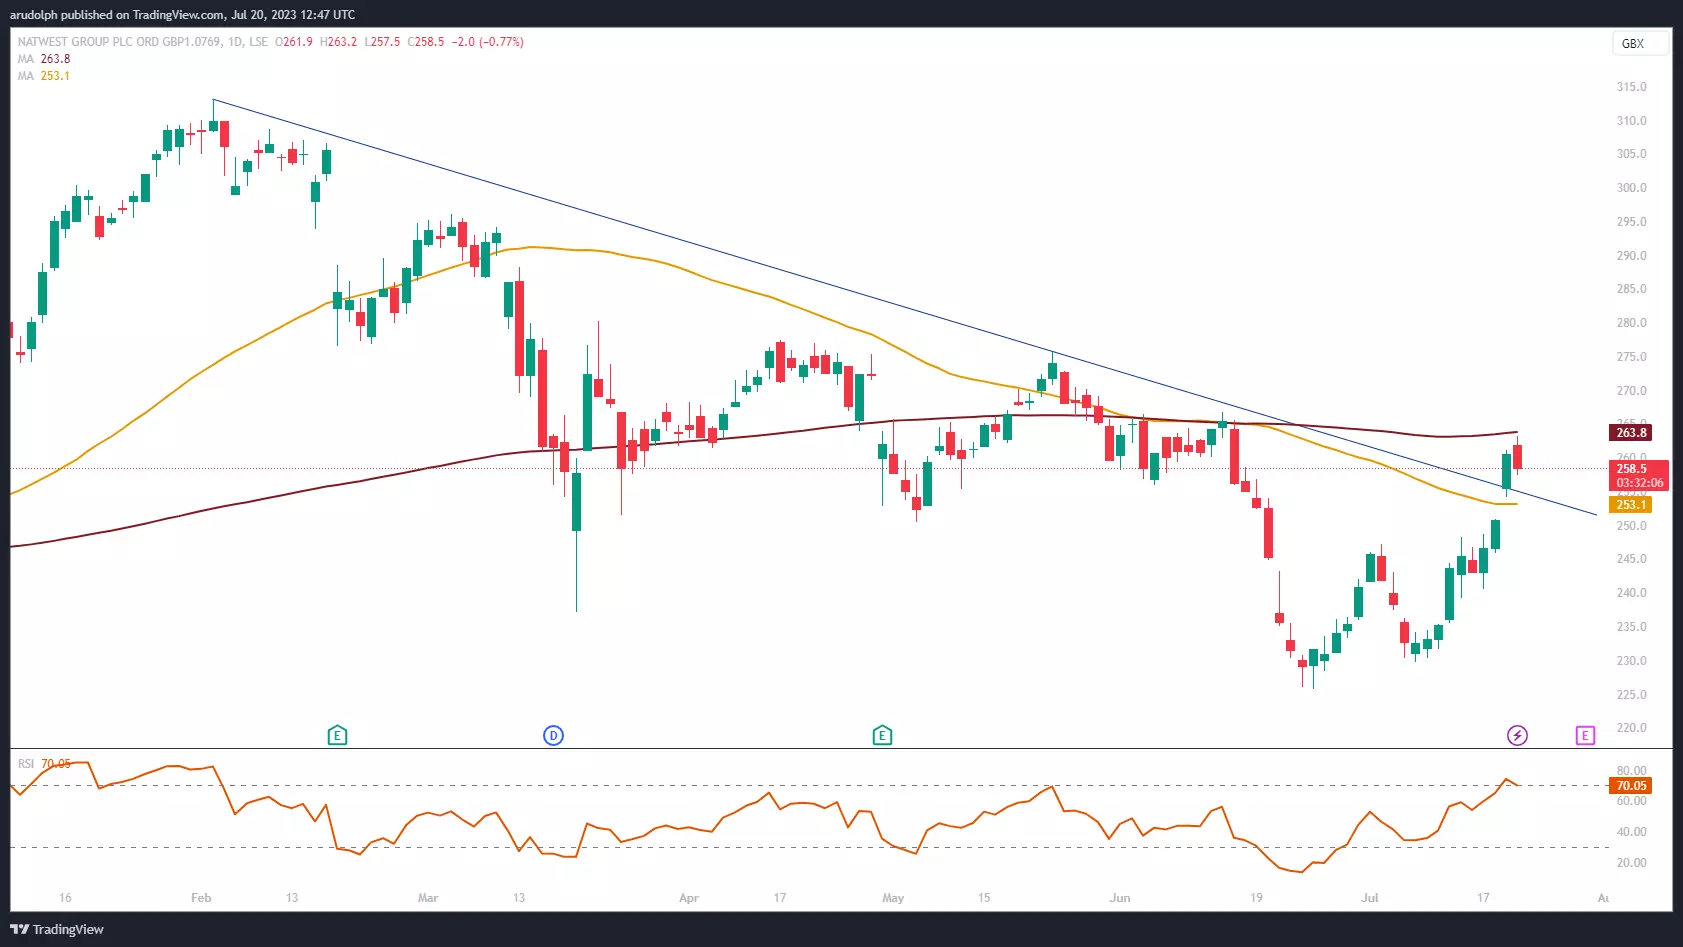
The fact that the NatWest share price has managed to break and close above its 2023 downtrend line at 255p is encouraging for the bulls.
A rise and daily chart close above the 200-day (SMA) and the mid-June high at 263.8p to 266.8p is needed to confirm a medium-term trend reversal.
Once this has happened, the February low, April and May highs at 275.6p to 277.4p will back in focus. Once bettered, the February peak at 313.1p would also be back in play.
This technical bullish view will remain valid as long as no potential decline takes the NatWest share price to below its June low at 225.7p.
This information has been prepared by IG, a trading name of IG Markets Ltd and IG Markets South Africa Limited. In addition to the disclaimer below, the material on this page does not contain a record of our trading prices, or an offer of, or solicitation for, a transaction in any financial instrument. IG accepts no responsibility for any use that may be made of these comments and for any consequences that result. No representation or warranty is given as to the accuracy or completeness of this information. Consequently any person acting on it does so entirely at their own risk. Any research provided does not have regard to the specific investment objectives, financial situation and needs of any specific person who may receive it. It has not been prepared in accordance with legal requirements designed to promote the independence of investment research and as such is considered to be a marketing communication. Although we are not specifically constrained from dealing ahead of our recommendations we do not seek to take advantage of them before they are provided to our clients. See full non-independent research disclaimer and quarterly summary.

Seize a share opportunity today
Go long or short on thousands of international stocks.
- Increase your market exposure with leverage
- Get spreads from just 0.1% on major global shares
- Trade CFDs straight into order books with direct market access
Live prices on most popular markets
- Forex
- Shares
- Indices
Prices above are subject to our website terms and agreements. Prices are indicative only