EUR/USD, EUR/GBP await ECB rate decision while GBP/USD finds support
Outlook on EUR/USD, EUR/GBP and GBP/USD ahead of the ECB rate decision, US retail sales and PPI.

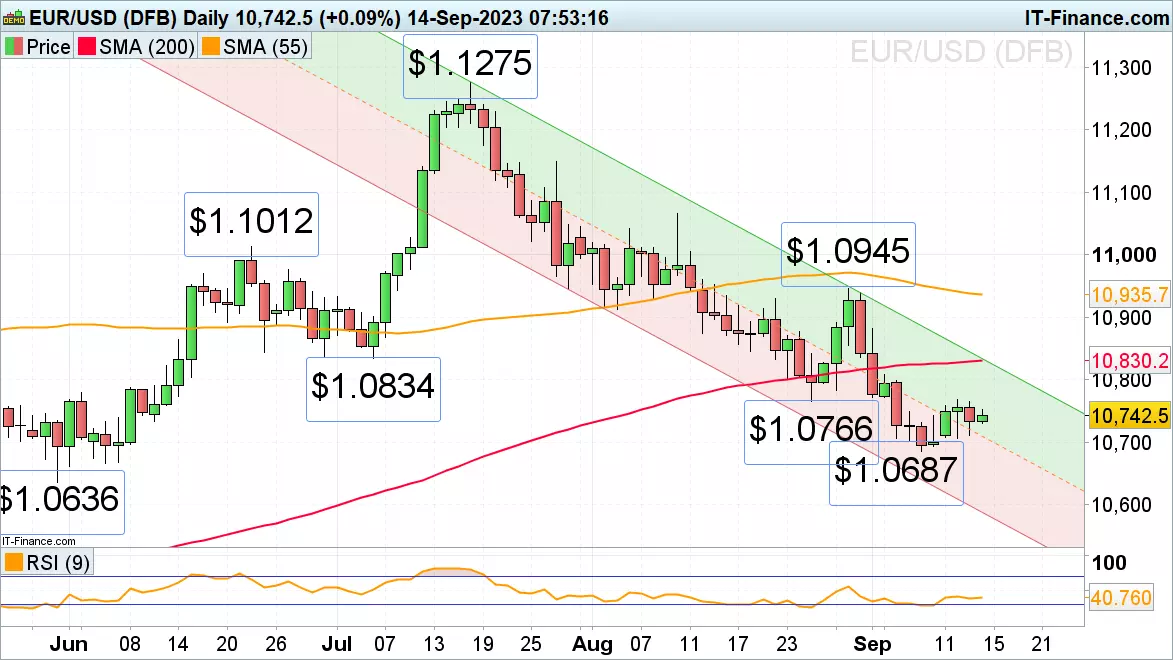
EUR/USD hovers above 3-month low ahead of ECB decision
EUR/USD continues to hover above its early September low at $1.0687 ahead of the European Central Bank’s (ECB) rate decision today in which another rate hike may be seen.
EUR/USD needs to rise above this week’s high at $1.0769 in order to attack the 200-day simple moving average (SMA) at $1.083 and the July low at $1.0834.
Failure at $1.0637 would lead to the May low at $1.0636 being targeted.
EUR/GBP traders await ECB rate decision
EUR/GBP remains within its June-to-September sideways trading range, now above the 55-day SMA at £0.8583 as traders await the ECB’s rate decision.
Only a rise above Wednesday’s high at £0.863 would put the $0.8658 to $0.8669 June and August highs in to the frame.
Slips through the 55-day SMA could lead to a slide towards Monday’s low at £0.8559. Further down lies the September low at £0.8524 which was formed close to key support seen between the £0.8522 to £0.8504 June and July lows.

GBP/USD holds above the 200-day SMA
GBP/USD remains above its 200-day SMA at $1.2434, which held the cross on Wednesday, despite UK house price balance hitting a 14-year low. It measures the gap between the percentage or respondents seeing rises and falls in house prices.
A slip through Wednesday’s low at $1.2435 may lead to the next lower June low at $1.2369 to be reached.
Resistance remains to be seen at the $1.2549 late August low and Monday’s high and then also at the $1.2591 June low. While next higher resistance at $1.2819 isn’t overcome, the medium-term trend remains bearish, though.

This information has been prepared by IG, a trading name of IG Markets Ltd and IG Markets South Africa Limited. In addition to the disclaimer below, the material on this page does not contain a record of our trading prices, or an offer of, or solicitation for, a transaction in any financial instrument. IG accepts no responsibility for any use that may be made of these comments and for any consequences that result. No representation or warranty is given as to the accuracy or completeness of this information. Consequently any person acting on it does so entirely at their own risk. Any research provided does not have regard to the specific investment objectives, financial situation and needs of any specific person who may receive it. It has not been prepared in accordance with legal requirements designed to promote the independence of investment research and as such is considered to be a marketing communication. Although we are not specifically constrained from dealing ahead of our recommendations we do not seek to take advantage of them before they are provided to our clients. See full non-independent research disclaimer and quarterly summary.

Start trading forex today
Trade the largest and most volatile financial market in the world.
- Spreads start at just 0.6 points on EUR/USD
- Analyse market movements with our essential selection of charts
- Speculate from a range of platforms, including on mobile
Live prices on most popular markets
- Forex
- Shares
- Indices
Prices above are subject to our website terms and agreements. Prices are indicative only