Gold price rallies while oil & natural gas prices struggle
While gold is moving higher to start the week, oil prices and natural gas prices have seen a more mixed morning of trading.

Gold marches higher
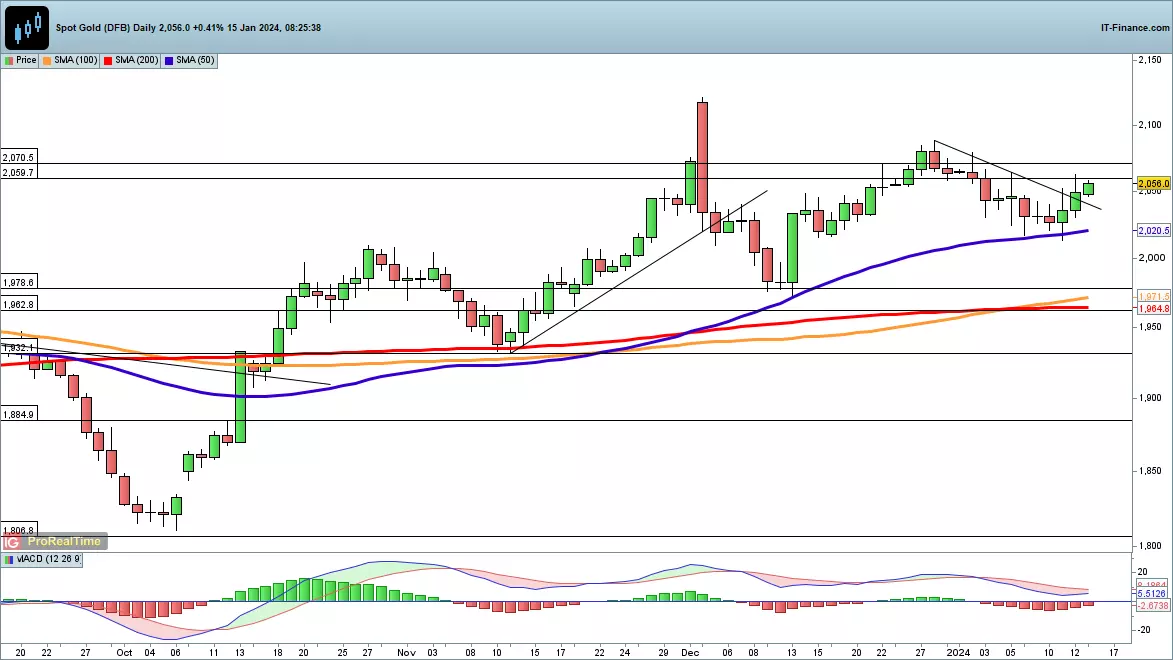
The price is making headway to the upside this morning, building on the strong finish to last week.
Last week saw the price bounce off the 50-day simple moving average (SMA), forming a higher low and reviving the uptrend. Friday saw the price close above trendline resistance from the late-December high, bolstering the bullish short-term narrative.
A close back below $2030 would negate this, while a drop back below the 50-day SMA points towards the possibility of additional short-term weakness.
Surge in Brent crude knocked back
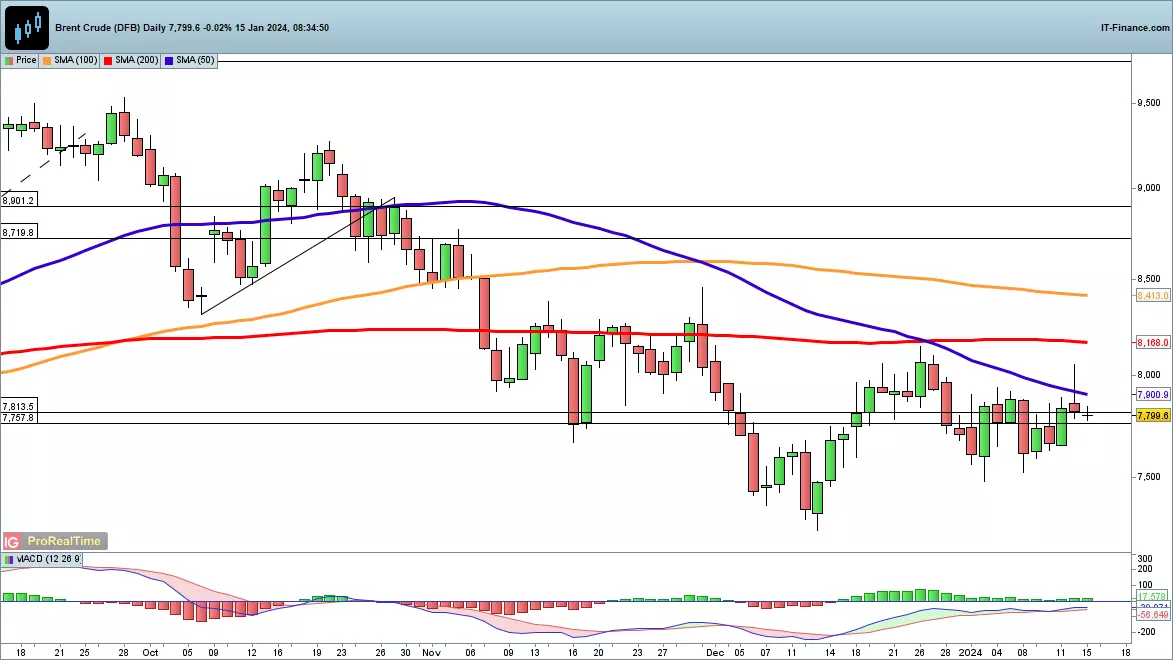
The volatility in crude oil prices continues. Friday witnessed a spike to $80 for Brent, in anticipation of the US/UK military action against the Houthis in Yemen.
However, the spike was short-lived, and the close below the 50-day SMA sends a potentially bearish signal. Sellers now need to follow through on this with a break below $75 that will open the way to the lows of December.
Buyers have been unable to hold on to gains over the past few months, and in the short-term a close above $80 and then the late December high at $81.40 would provide a short-term bullish view.
Natural Gas gaps lower
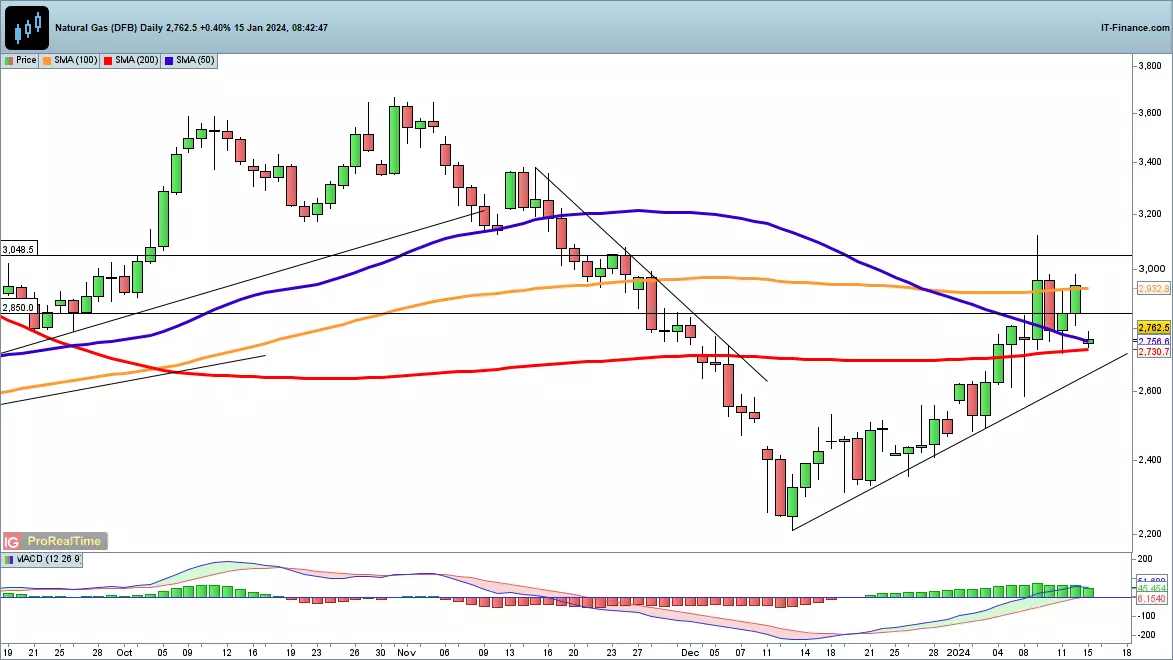
After the surge from the December lows, the price has hit a road block, slumping back to the 200-day SMA, though leaving the uptrend from the lows of December intact.
A close below 2670 would be needed to break trendline support from mid-December, which would reinforce the view that a lower high has been created. This might then renew the downtrend from early-November and put the lows of late December in play.
Renewed strength targets last week’s highs around 2975, and a close above 3000 marks a fresh bullish development.
This information has been prepared by IG, a trading name of IG Markets Ltd and IG Markets South Africa Limited. In addition to the disclaimer below, the material on this page does not contain a record of our trading prices, or an offer of, or solicitation for, a transaction in any financial instrument. IG accepts no responsibility for any use that may be made of these comments and for any consequences that result. No representation or warranty is given as to the accuracy or completeness of this information. Consequently any person acting on it does so entirely at their own risk. Any research provided does not have regard to the specific investment objectives, financial situation and needs of any specific person who may receive it. It has not been prepared in accordance with legal requirements designed to promote the independence of investment research and as such is considered to be a marketing communication. Although we are not specifically constrained from dealing ahead of our recommendations we do not seek to take advantage of them before they are provided to our clients. See full non-independent research disclaimer and quarterly summary.

See an opportunity to trade?
Go long or short on more than 17,000 markets with IG.
Trade CFDs on our award-winning platform, with low spreads on indices, shares, commodities and more.
Live prices on most popular markets
- Forex
- Shares
- Indices
Prices above are subject to our website terms and agreements. Prices are indicative only