What is a shooting star candlestick and how do you trade it?
Candlesticks provide plenty of insight into how market prices might behave. These patterns could signal entry and exit points for your trade. Discover one of the most significant candlesticks in trading – the shooting star.


What is a shooting star candlestick pattern?
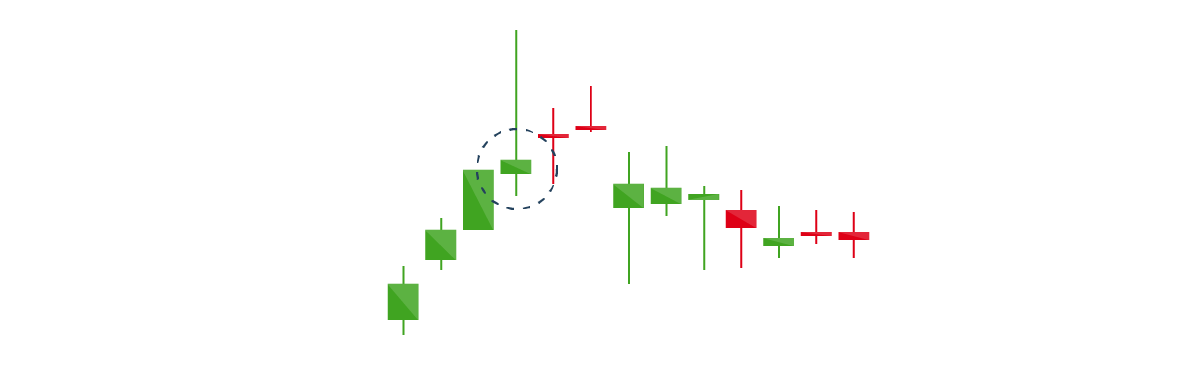
A shooting star candlestick pattern is a chart formation that occurs when an asset’s market price is pushed up quite significantly, but then rejected and closed near the open price. This creates a long upper wick, a small lower wick and a small body.
The upper wick must take up at least half of the length of the candlestick for it to be considered a shooting star. And, it must appear at the top of an uptrend. As a result, the shooting star candlestick pattern is often thought to be a possible signal of bearish reversal. This means an uptrend might not continue (prices may fall).
Traders should be careful not to confuse the shooting star pattern with the inverted hammer candlestick – as both have a longer upper wick and small body. However, the inverted hammer signals bullish as opposed to bearish reversal, and it is often observed at the bottom of a downtrend.
Learn about 16 candlestick patterns that can be useful if you’re a beginner
Shooting star pattern example
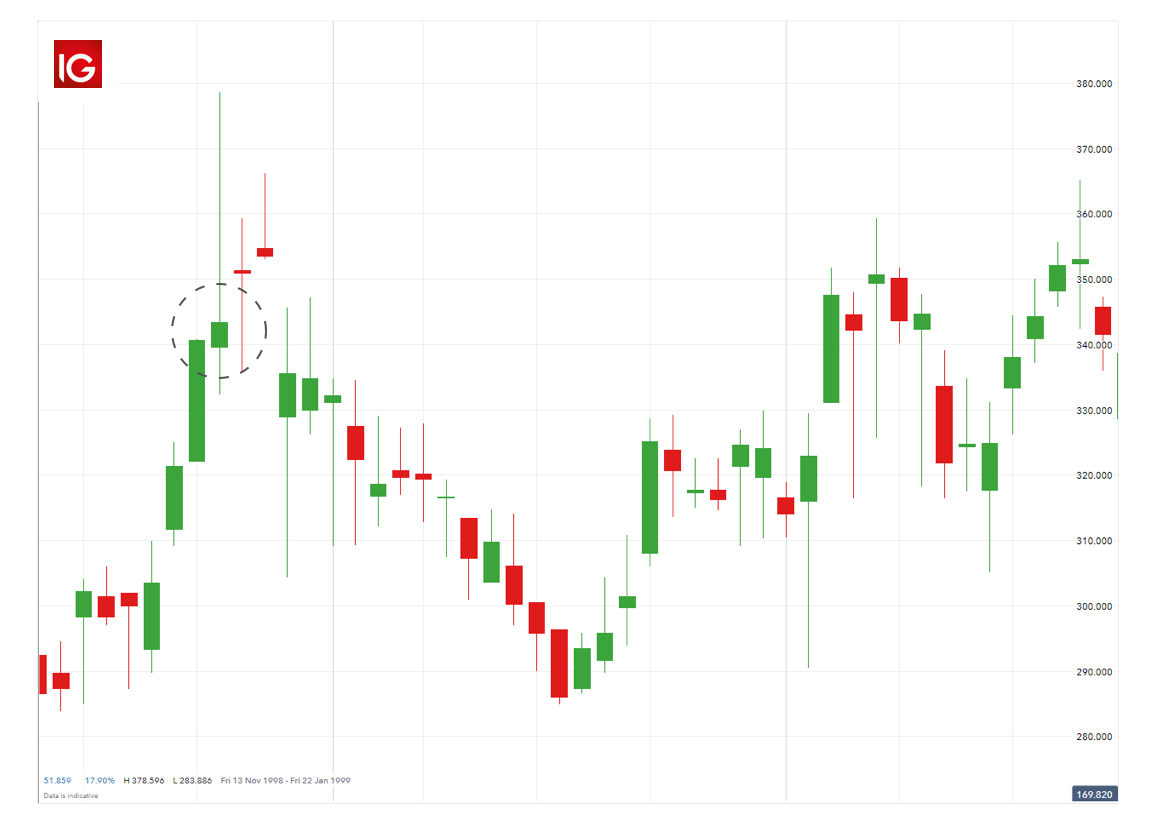
Let’s say you’re following the Barclays share price, which opens the trading day at $339.60. The share price starts going down, reaching $334.30, but then some good news within the company causes the share price to rise rapidly, reaching a high of $379.60. Finally, it closes at $342.30. These movements create a shooting star candlestick, as pictured below.
Interested in Barclays shares? Learn how to trade its share price movements
Benefits of the shooting star pattern in technical analysis
One of the main benefits of the shooting star pattern in technical analysis is that it is a simple formation to identify. Further, it is reasonably reliable in identifying a bearish reversal – especially if it appears near a resistance level.
Keep in mind that the shooting star candlestick should never be viewed in isolation. Before acting on the formation, confirm the signal using technical indicators. For example, if you think that a shooting star at the top of an uptrend means possible reversal, you can test the bearish bias using Fibonacci retracement. This indicator can pinpoint the degree to which a market will move against its current trend.
How to trade when you see the shooting star pattern
There are a few steps you should follow if you want to trade when you see the shooting star pattern. Remember that the shooting star could indicate negative reversal – in other words, market prices could go down. If you want to take advantage of falling prices, you can do so via derivatives such as CFDs.
Follow these steps to go short when you see the shooting star candlestick:
- Open an IG trading account or log in to your existing account
- Look for the asset you want to trade in the search bar
- Enter your position size
- Select ‘sell’ in the deal ticket and confirm the trade
To practise trades before committing to a live trading account, you can try out the IG demo account. You’ll get $200,000 in virtual funds to trade in a risk-free environment.
Shooting star candlestick pattern summed up
A shooting star candlestick pattern occurs when an asset’s market price is pushed up quite significantly, but then rejected and closed near the open price. It could be a possible signal of bearish reversal, meaning an uptrend might not continue.
To start trading today, open a live IG account in just a few minutes or sign up for a demo account.
IGA, may distribute information/research produced by its respective foreign affiliates within the IG Group of companies pursuant to an arrangement under Regulation 32C of the Financial Advisers Regulations. Where the research is distributed in Singapore to a person who is not an Accredited Investor, Expert Investor or an Institutional Investor, IGA accepts legal responsibility for the contents of the report to such persons only to the extent required by law. Singapore recipients should contact IGA at 6390 5118 for matters arising from, or in connection with the information distributed.
The information/research herein is prepared by IG Asia Pte Ltd (IGA) and its foreign affiliated companies (collectively known as the IG Group) and is intended for general circulation only. It does not take into account the specific investment objectives, financial situation, or particular needs of any particular person. You should take into account your specific investment objectives, financial situation, and particular needs before making a commitment to trade, including seeking advice from an independent financial adviser regarding the suitability of the investment, under a separate engagement, as you deem fit.
Please see important Research Disclaimer.

Explore the markets with our free course
Discover the range of markets you can trade on - and learn how they work - with IG Academy's online course.
