Best MACD trading strategies
The moving average convergence divergence (MACD) indicator can identify opportunities across financial markets. Learning how to implement the tool is crucial to a trader’s success, so we’ve looked at three common MACD strategies.


What is MACD?
Moving average convergence divergence (MACD) is one of the most commonly used techincal analysis indicators. It is a trend-following momentum indicator, meaning it looks at an asset’s momentum to ascertain whether the trend is up or down, and as such can be used to provide trading signals and identify trading opportunities.
How does MACD work?
The MACD indicator works using three components: two moving averages and a histogram.
The two lines within the indicator may look like simple moving averages (SMAs), but they are in fact layered exponential moving averages (EMAs). The main, slower line is the MACD line, while the faster line is the signal line.
If the two moving averages come together, they are said to be ‘converging’ and if they move away from each other they are ‘diverging’. The difference between the two lines is represented on the histogram. If the MACD were to be trading above the zero line, it would confirm an uptrend, below this and the indicator would be used to confirm a downtrend.
If the market price was found to be trending upward – reaching higher highs and higher lows, as well as breaking key levels of resistance – traders might enter long positions. While traders might opt to enter a short position if the asset was in a downtrend, characterised by the lower highs and lower lows, or breaks in support levels.
.png/jcr:content/renditions/original-size.webp)
Three common MACD trading strategies
There are a range of MACD strategies that can be used to find opportunities in markets. Three of the most popular strategies include:
Crossovers
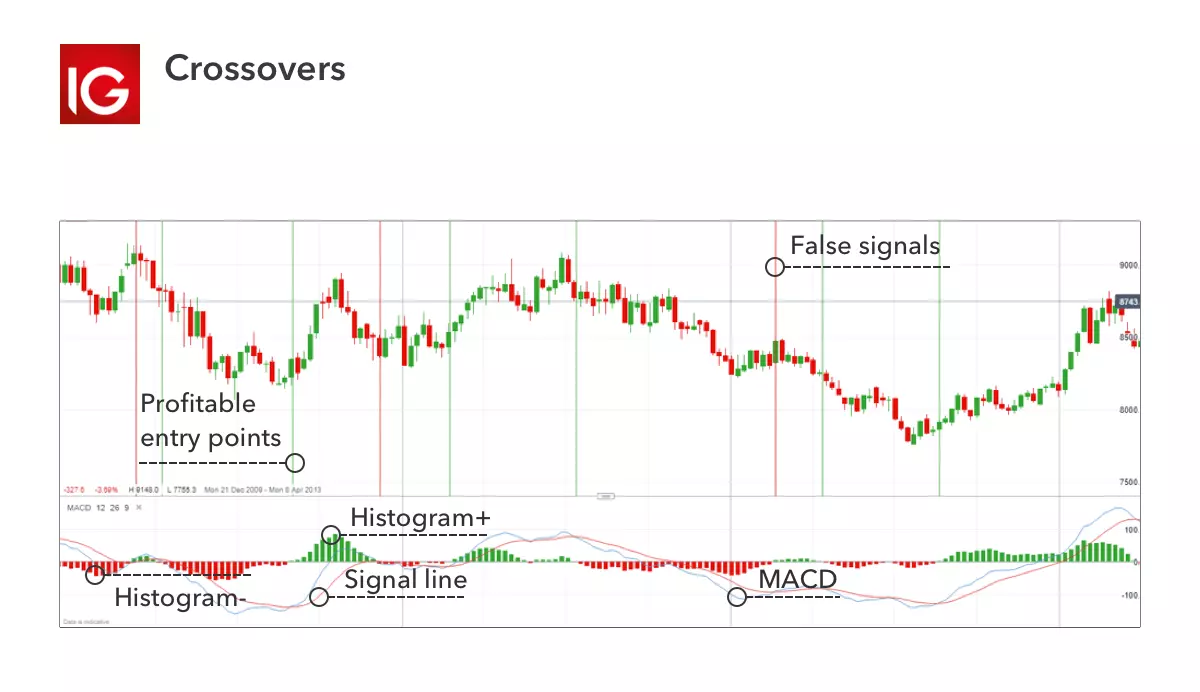
The MACD line and signal line can be utilised in much the same manner as a stochastic oscillator, with the crossover between the two lines providing buy and sell signals. As with most crossover strategies, a buy signal comes when the shorter-term, more reactive line – in this case the MACD line – crosses above the slower line – the signal line. Conversely, when the MACD line crosses below the signal line it provides a bearish sell signal.
As the crossover strategy is lagging by nature, it is based on waiting for a movement to occur before opening a position. The main issue faced by the MACD in weaker market trends, is that by the time a signal is generated, the price may be reaching a reversal point. This would then be considered a ‘false signal’. It is worth noting that strategies which utilise price action for confirmation of a signal are often seen as more reliable.
The chart below highlights this standard crossover strategy. Profitable entry points are highlighted by the green vertical lines, while false signals are highlights by the red lines.
Histogram reversals
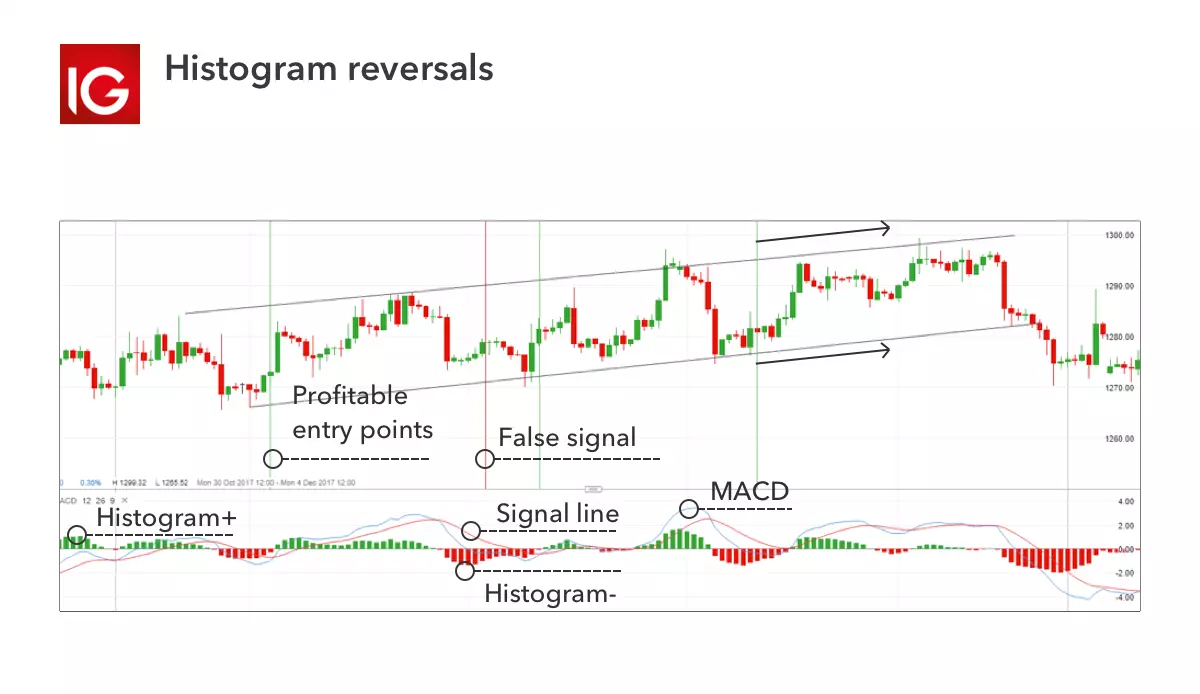
The histogram is arguably the most useful part of MACD, with the bars representing the difference between the MACD and signal lines. When the market price is moving strongly in a direction, the histogram will increase in height, and when the histogram shrinks, it is a sign the market is moving slower.
This means that as the bars on the histogram move further away from zero, the two moving average lines are moving further apart. Once the initial expansion phase is over, a hump shape will likely emerge – this is a signal that the moving averages are tightening again, which can be an early sign that a crossover is impending.
This is a leading strategy, in contrast to the lagging crossover strategy mentioned above. The histogram reversal is based on using known trends as the basis for placing positions, which means the strategy can be executed before the market movement actually takes place.
The chart below highlights the potential to utilise the MACD histogram as a trading tool. By waiting for two counter-trend moves in the histogram, it mitigates the chance that such a move will be a one-off rather than a reversal. By using the tool in the direction of the trend, the chart below highlights three profitable trades and one losing trade. A trader can also use the tool for exiting the trade, with positions exited once the MACD starts to reverse into the opposite direction.
Zero crosses
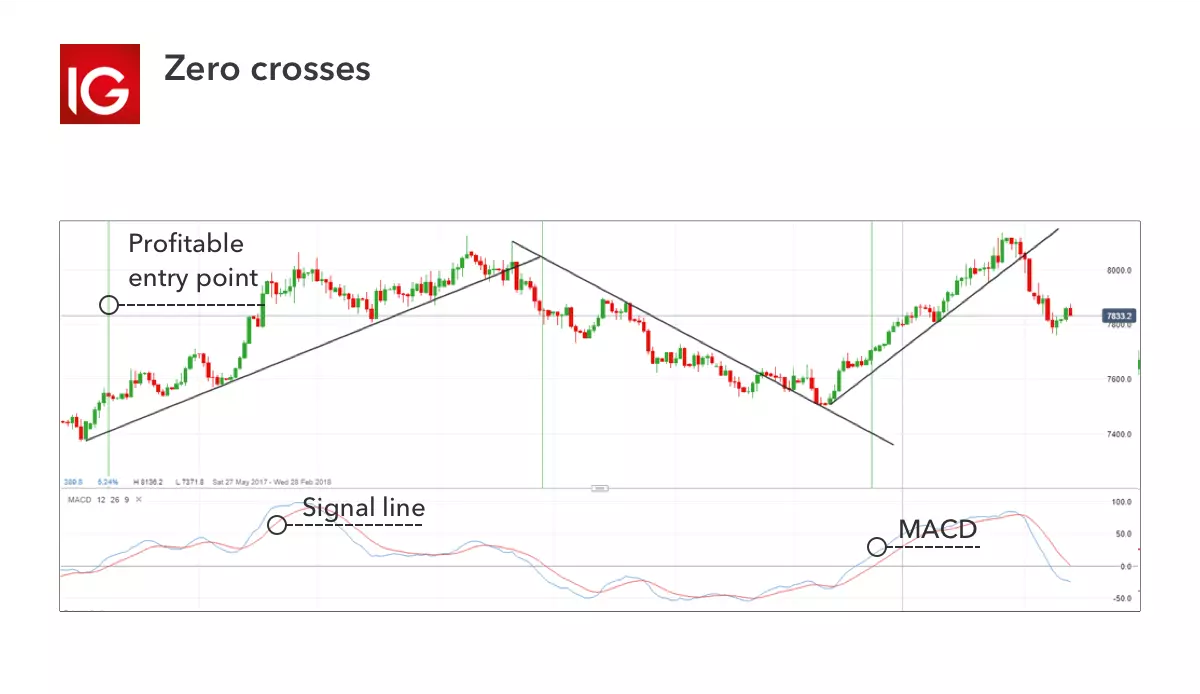
The zero cross strategy is based on either of the EMAs crossing the zero line. If the MACD crosses the zero line from below, a new uptrend may be emerging, while the MACD crossing from above is a signal that a new downtrend may be starting.
This is often seen as the slowest signal of the three, so you will typically see fewer signals, but also fewer false reversals. The strategy is to buy – or close a short position – when the MACD crosses above the zero line, and sell – or close a long position – when the MACD crosses below the zero line.
This method should be used carefully, as the delayed nature means that fast, choppy markets would often see the signals issued too late. However, as a tool for providing reversal signals of long sweeping moves, this can be very useful.
The chart below highlights three past signals on AUD/USD, with the indicator about to issue a fourth. Each of these would have proved profitable if the trader had entered and exited at the correct place. And a number of false signals would have been averted by following the zero cross method, instead of the crossover method.
When using the zero cross strategy, it is crucial to understand where to exit the market, or place a stop. The market in the below example provides several trendline breaks, which would have signalled a good time to exit the trade. Alternatively, a trader could use a break below the previous swing low (uptrend) or above the prior swing high (downtrend) to exit the trade.
When is the best time to use MACD?
There is no such thing as a ‘best’ time to use the MACD indicator, this will be completely down to you, your personal preferences and trading plan. For some, there may be no correct time to use the MACD indicator, as they don’t take a technical approach to analysis, or choose to use a variety of other indicators to determine price action.
However, if you choose to use MACD, the best time to use the indicator will depend on which of the above strategies you’re looking to utilise. If you choose a lagging strategy, you’d have to be watching your MACD indicator a lot to receive the signals as quickly as possible. But if you chose a leading strategy, like the histogram, you might be able to spend less time monitoring your MACD, as the signals should present themselves ahead of time.
MACD strategy key takeaways
- MACD is one of the most commonly used technical analysis indicators
- It works using three components: two moving averages and a histogram
- If the two moving averages come together, they are said to be ‘converging’ and if they move away from each other they are ‘diverging’
- The difference between the lines is represented on the histogram
- There are three common MACD strategies: crossovers, histogram reversals and zero crosses
- There is no best time to use MACD, as it’s completely down to personal preference and each individual’s trading plan
IGA, may distribute information/research produced by its respective foreign affiliates within the IG Group of companies pursuant to an arrangement under Regulation 32C of the Financial Advisers Regulations. Where the research is distributed in Singapore to a person who is not an Accredited Investor, Expert Investor or an Institutional Investor, IGA accepts legal responsibility for the contents of the report to such persons only to the extent required by law. Singapore recipients should contact IGA at 6390 5118 for matters arising from, or in connection with the information distributed.
The information/research herein is prepared by IG Asia Pte Ltd (IGA) and its foreign affiliated companies (collectively known as the IG Group) and is intended for general circulation only. It does not take into account the specific investment objectives, financial situation, or particular needs of any particular person. You should take into account your specific investment objectives, financial situation, and particular needs before making a commitment to trade, including seeking advice from an independent financial adviser regarding the suitability of the investment, under a separate engagement, as you deem fit.
Please see important Research Disclaimer.

Explore the markets with our free course
Discover the range of markets you can trade on - and learn how they work - with IG Academy's online course.
