How to trade using price gap analysis
Price gap analysis is a popular form of technical analysis used by traders in financial markets, particularly when trading equities.


What is a price gap?
A price gap is an area on a chart where no trading activity has taken place. These gaps can be identified when using ‘bar’ or ‘candlestick’ charts.
A gap up means that the low of the current candle is higher than the high of the previous candle.

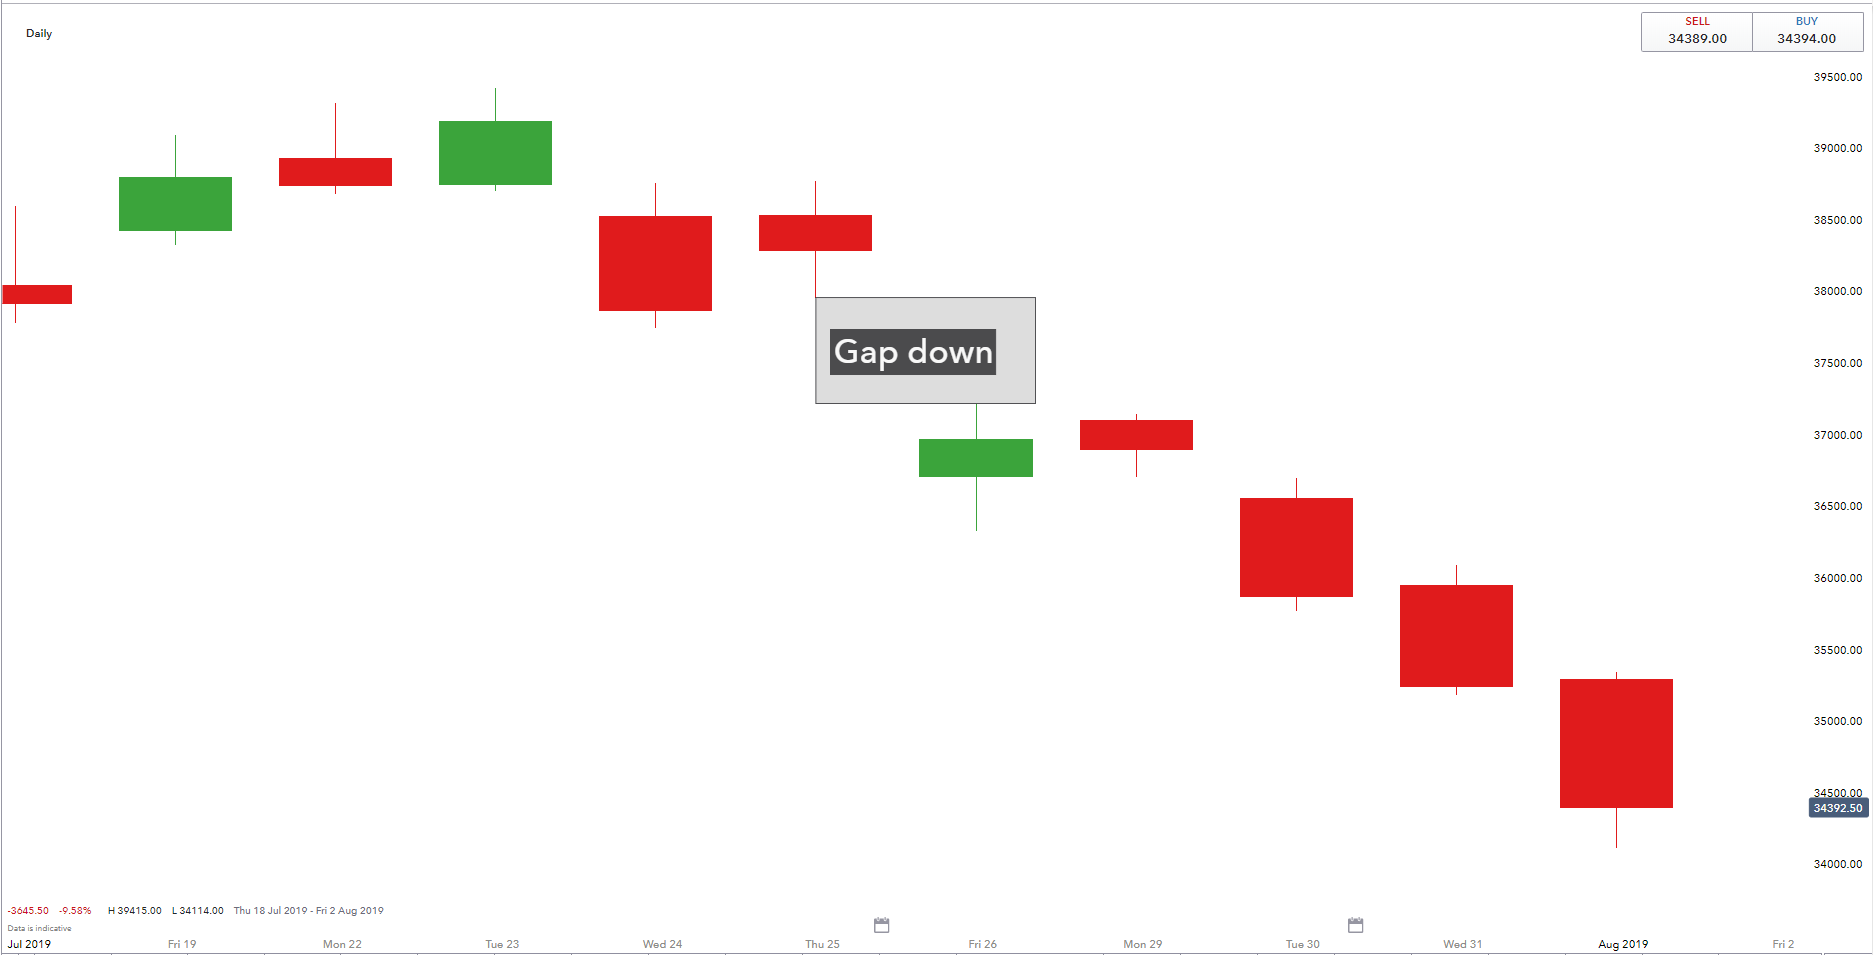
A gap down means that the high of the current candle is lower than the low of the previous candle.
Price gaps can have different indications depending on where they occur within a trend or consolidation.
Types of price gaps
In technical analysis there are three main price gap considerations:
Breakaway gap
A breakaway gap highlights the start of a new directional move. This type of gap occurs either after a price consolidation or against the general trend direction.

The above chart highlights a breakaway gap to the downside, following a period of consolidation. The gap suggests the emergence of a new downtrend. Traders would look to align trades in the same direction as the breakaway gap, rather than look to trade against the directional momentum. The same principles would apply to a gap up after a consolidation, ie this would be a suggestion that a new uptrend is emerging for traders to align with.

The above chart highlights a breakaway gap to the downside, in the opposite direction of what was the prevailing trend. The gap suggests the uptrend to be reversing into a new downtrend. Traders would look to align trades in the same direction as the breakaway gap, rather than look to trade against the directional momentum. The same principles would apply to a gap up after a downtrend, ie this would be a suggestion of a trend reversal from down to up.
Runaway/measuring gap
A runaway/measuring gap occurs mid trend and suggests that the price is now moving effortlessly in a direction. Measuring gaps are considered continuation patterns as they have a habit of occurring before the trend which preceded the gap is resumed, ie in an uptrend a measuring gap up alludes to further gains to follow. In a downtrend, a measuring gap down alludes to further decline.
The length of the trend which preceded the gap can be projected from the gap’s occurrence to provide traders with a ‘measured’ target, hence the term ‘measuring’ gap.
The chart below highlights a measuring gap in an uptrend.

Exhaustion gap
An exhaustion gap is considered when the price produces a series of price gaps late in a trend. Unlike breakaway and runaway/measuring gaps, these patterns suggest that a move in a direction may be nearing an end or possibly setting up to reverse course. Traders who identify these exhaustion gaps in a mature trend might look to exit their trading positions or wait for further confirmation of a trend reversal.

The above chart shows an exhaustion gap late in a downtrend, which highlighted the end of the move lower and the start of a new uptrend. In an uptrend an exhaustion gap would suggest the uptrend to be nearing an end and possibly reversing into a new downtrend.
Gaps must be filled
There is an assumption amongst some traders that gaps must be filled, meaning that the price is expected to return to the gap area at a future date.
Breakaway and runaway gaps are believed to have a lower probability of being filled. This is due to the assumption that the market event which caused this type of gap to occur carries a strong directional momentum. Trading for a gap fill would therefore equate to trading against this momentum and trading against the newly formed trend.
Traders looking to trade a ‘gap fill’ might prefer to do so in the event of an exhaustion gap. An exhaustion gap suggests the directional move to be capitulating and possibly reversing course. This assumes a higher probability to trading for a ‘gap fill’.
How to start trading gaps
- Do your research. Study the information in this article, and take a look at IG’s trading strategy and planning section
- Understand the risks involved when trading, and make a trading plan
- Open an account to get started. Practise with $200,000 of virtual funds on IG’s trading simulator, or open a live account if you’re ready to trade gaps for real
- Place your first trade
Gap trading summed up
- A price gap is an area on a chart where no trading activity has taken place (since its occurrence)
- Price gaps can be identified using candlestick or bar graphs
- A gap up is when the low of a candle/bar is higher than the high of the previous candle/bar
- A gap down is when the high of a candle/bar is lower than the low of the previous candle/bar
- A breakaway gap shows the start of a new directional move from a consolidation or in the opposite direction of the underlying trend
- A runaway/measuring gap appears mid trend and shows the price moving effortlessly in a direction, expectant of that directional trend will be continued
- An exhaustion gap occurs in a mature trend and suggests the capitulation of a trend and possible reversal thereof
- A ‘gap fill’ is noted when the price returns to trade in the area where previously there was no trading activity
- Trading for a ‘gap fill’ suggests trading against a directional price move and is preferable in the event of an exhaustion gap (not preferable in the event of a breakaway or runaway gap)
IGA, may distribute information/research produced by its respective foreign affiliates within the IG Group of companies pursuant to an arrangement under Regulation 32C of the Financial Advisers Regulations. Where the research is distributed in Singapore to a person who is not an Accredited Investor, Expert Investor or an Institutional Investor, IGA accepts legal responsibility for the contents of the report to such persons only to the extent required by law. Singapore recipients should contact IGA at 6390 5118 for matters arising from, or in connection with the information distributed.
The information/research herein is prepared by IG Asia Pte Ltd (IGA) and its foreign affiliated companies (collectively known as the IG Group) and is intended for general circulation only. It does not take into account the specific investment objectives, financial situation, or particular needs of any particular person. You should take into account your specific investment objectives, financial situation, and particular needs before making a commitment to trade, including seeking advice from an independent financial adviser regarding the suitability of the investment, under a separate engagement, as you deem fit.
Please see important Research Disclaimer.

Explore the markets with our free course
Discover the range of markets you can trade on - and learn how they work - with IG Academy's online course.
