US stock indices on track for bumper Monthly and Quarterly gains
US stock indices rebounded overnight, supported by the release of robust US economic data that eased slowdown concerns. Find out below what comes next.


US stock indices rebounded overnight, supported by the release of robust US economic data that eased slowdown concerns.
With two full trading sessions left to go, the Nasdaq is up 4.85% in June and 13.39% for the June quarter, building on a 20.5% gain in the March quarter. The S&P500 is up 4.71% in June and 6.51% for the June quarter. The perennial underachiever, the Dow Jones, is up 3.9% for the month and 1.96% for the quarter.
Behind the bumper performance in US stock indices this month and this quarter, the earlier-than-expected resolution to the debt ceiling saga played its part, as did signs of cooing inflation which allowed the Federal Reserve (Fed) pausing of its rate hiking cycle. Topping it off, the chase for mega tech/AI stocks continued for names including Nvidia, Apple, Tesla, Microsoft, Google, and Amazon.
Aside from possible month-end and quarter-end rebalancing flows, the next critical events for US stock indices are a speech by Fed Chair Jerome Powell this evening and the Core Personal Consumption Expenditure (PCE) price index release on Friday night.
For those wondering when the rally in US stock indices might end, remember that July is seasonally the strongest month of the year. Over the past ten years, the S&P500 has had an average return of 3.27% in July. For the Nasdaq, it’s even better, with an average return of 5.06% in July over the past ten years.
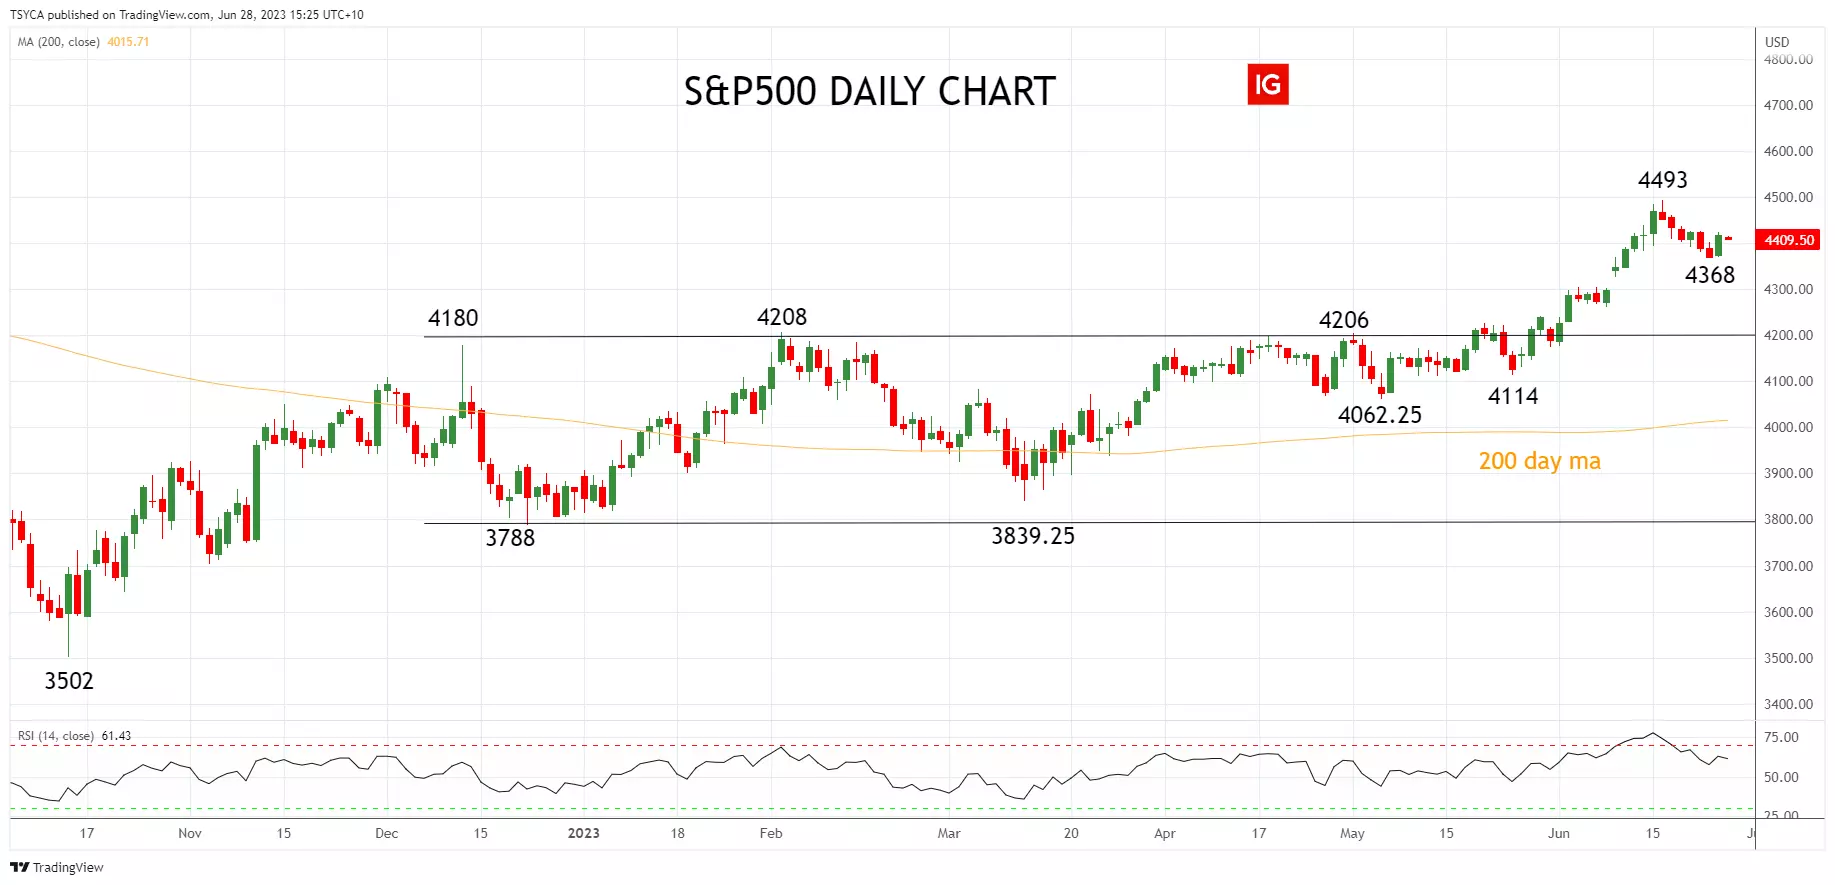
S&P500 Technical Analysis
In our last update here, we outlined some potential support levels where a correction in the S&P500 might find support.
Despite the volatility that month-end and quarter-end rebalancing can create, the pullback from the 4493 high is viewed as a correction rather than a reversal. As such, we continue to highlight the August 4325 high and then the 4250 level as support areas where buyers will likely emerge, looking to position for the next leg higher towards 4600.
Aware that only a sustained break below support at 4165 (SPX) and 4180/70 in the continuous futures contract would negate the positive medium-term outlook.
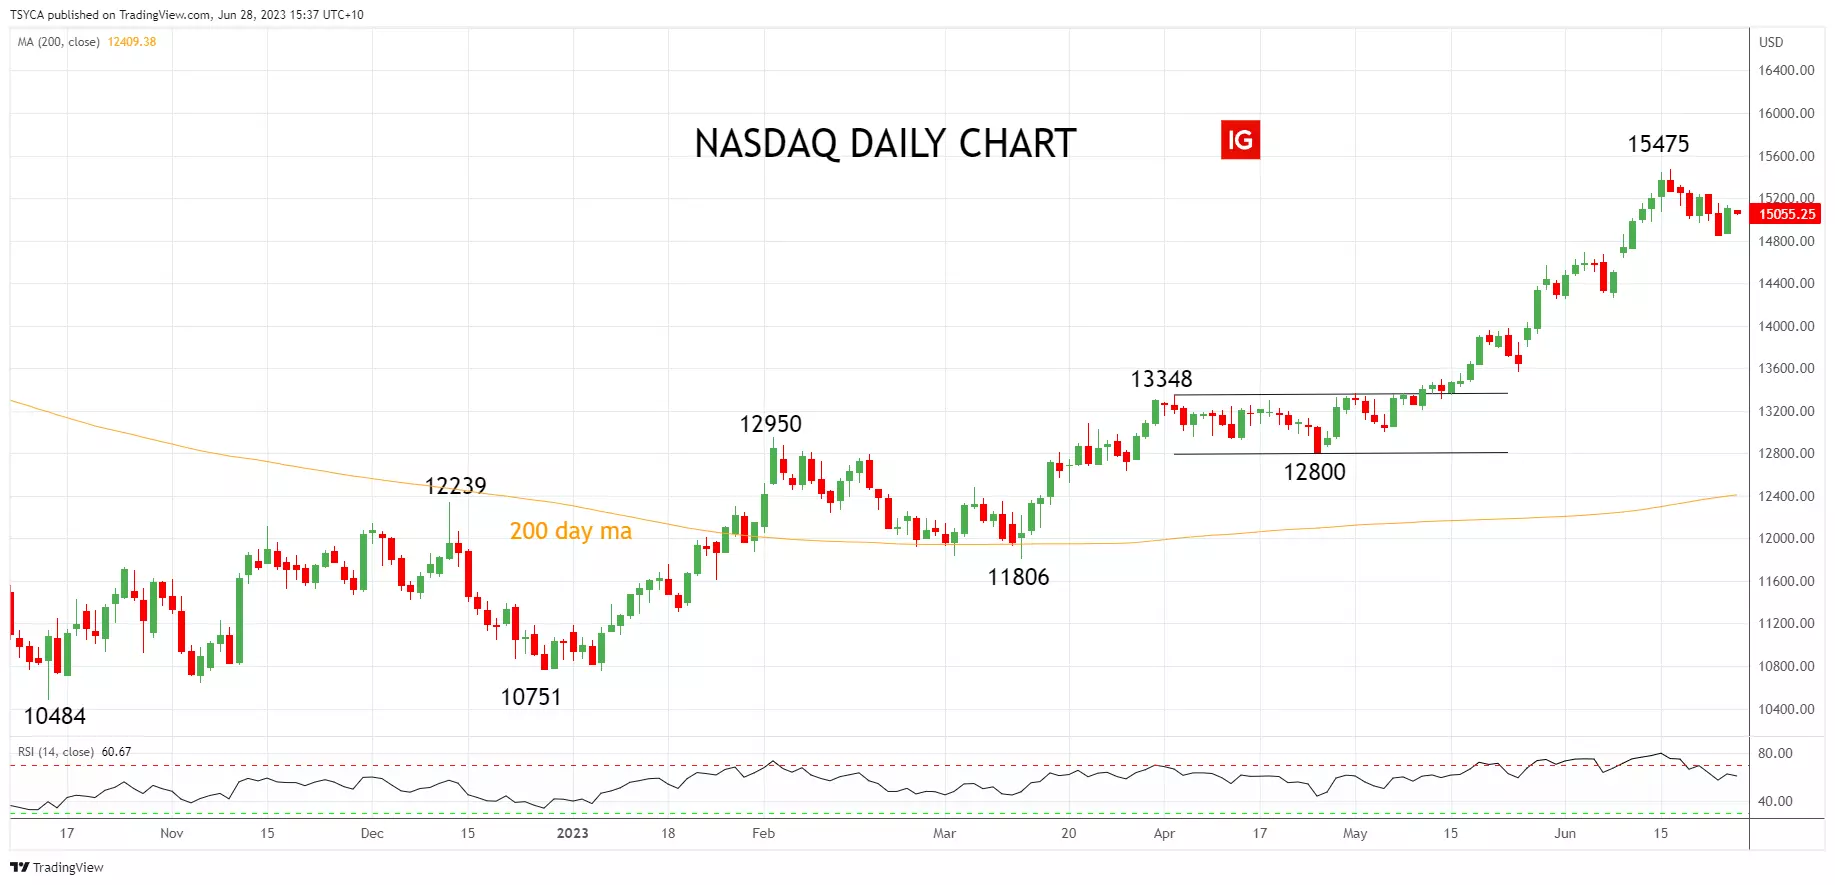
Nasdaq Technical Analysis
In line with the view above, the pullback from the 15475 high is viewed as a correction rather than the start of a reversal lower.
As we have noted frequently in recent months, the pursuit of Tech/AI-related stocks is expected to remain a driver of the Nasdaq in the months ahead, with AI technology still too early in its lifecycle to disappoint relative to lofty expectations.
As such, we expect dip buyers to emerge towards a band of support at 14,500/14,250 and again at 14,000.
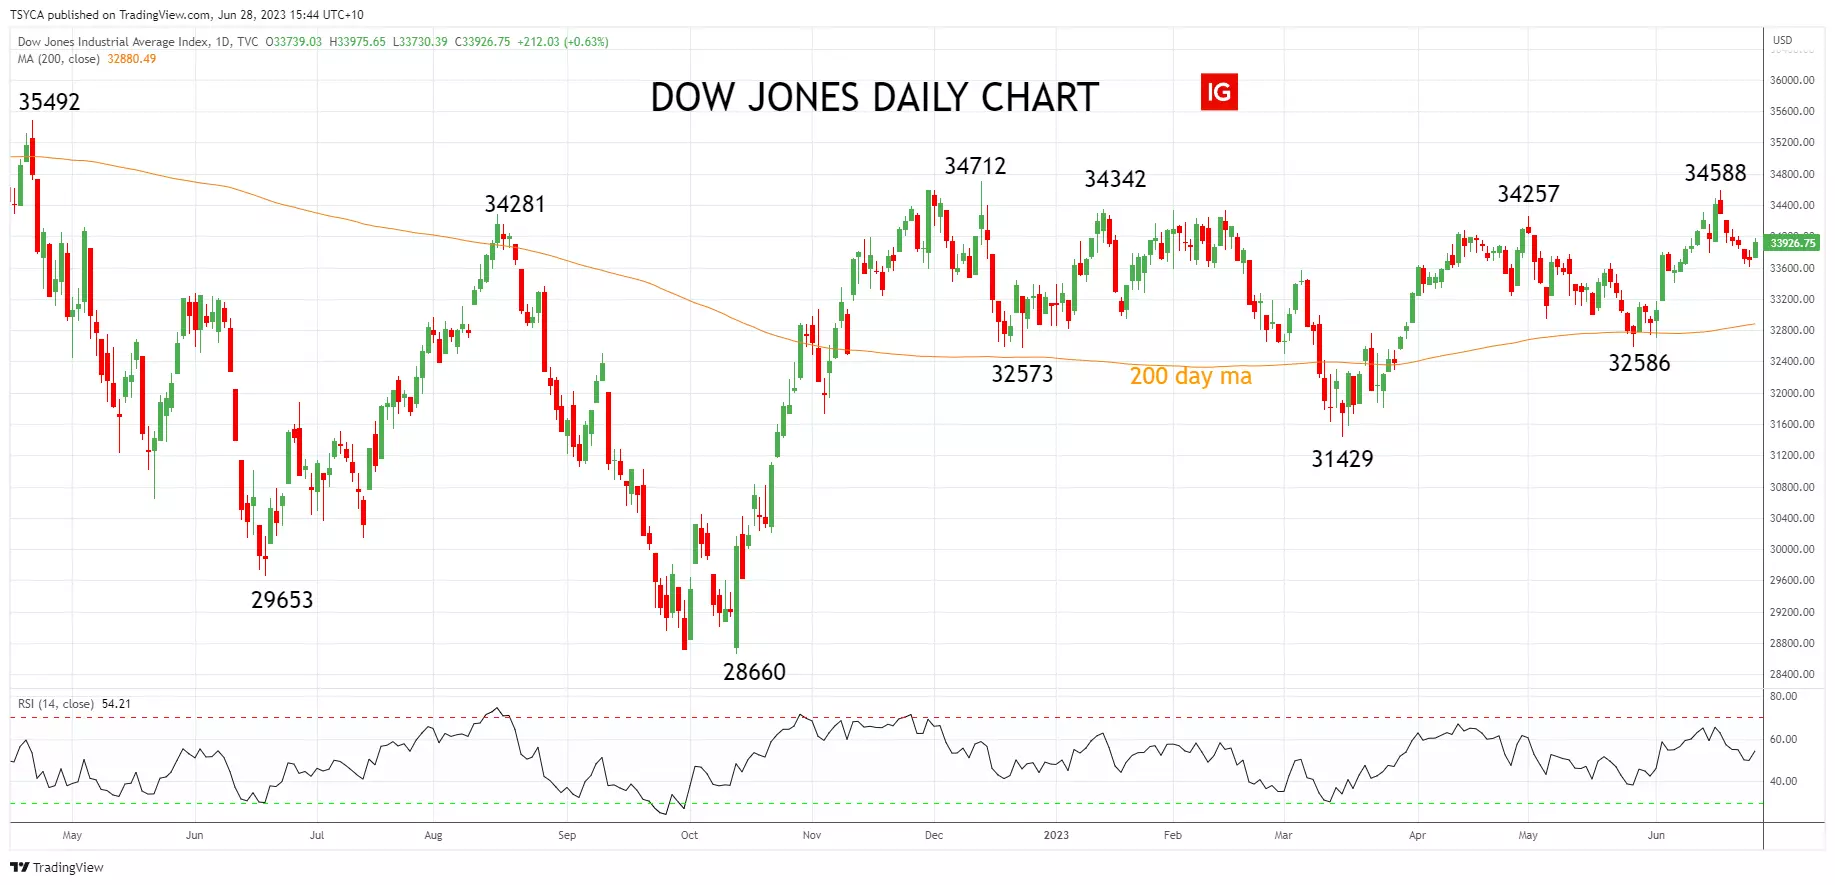
Dow Jones Technical Analysis
No change - the December 34,712 high remains the last band of resistance preventing the Dow Jones from setting up a test of the 35,492 high (from April 2022) before a run at the all-time 36,952 high. Until that occurs, the Dow Jones will likely continue to flounder in the shadows of the S&P500 and the Nasdaq.
On the downside, the Dow Jones is expected to continue to find good support, initially at 33,500 and then from the 200-day moving average, currently at 32,808.
IGA, may distribute information/research produced by its respective foreign affiliates within the IG Group of companies pursuant to an arrangement under Regulation 32C of the Financial Advisers Regulations. Where the research is distributed in Singapore to a person who is not an Accredited Investor, Expert Investor or an Institutional Investor, IGA accepts legal responsibility for the contents of the report to such persons only to the extent required by law. Singapore recipients should contact IGA at 6390 5118 for matters arising from, or in connection with the information distributed.
The information/research herein is prepared by IG Asia Pte Ltd (IGA) and its foreign affiliated companies (collectively known as the IG Group) and is intended for general circulation only. It does not take into account the specific investment objectives, financial situation, or particular needs of any particular person. You should take into account your specific investment objectives, financial situation, and particular needs before making a commitment to trade, including seeking advice from an independent financial adviser regarding the suitability of the investment, under a separate engagement, as you deem fit.
No representation or warranty is given as to the accuracy or completeness of this information. Consequently, any person acting on it does so entirely at their own risk. Please see important Research Disclaimer.
Please also note that the information does not contain a record of our trading prices, or an offer of, or solicitation for, a transaction in any financial instrument. Any views and opinions expressed may be changed without an update.

Take a position on indices
Deal on the world’s major stock indices today.
- Trade the lowest Wall Street spreads on the market
- 1-point spread on the FTSE 100 and Germany 40
- The only provider to offer 24-hour pricing
Live prices on most popular markets
- Forex
- Shares
- Indices
See more forex live prices
See more shares live prices
Prices above are subject to our website terms and agreements. Prices are indicative only. All shares prices are delayed by at least 15 mins.
See more indices live prices
Prices above are subject to our website terms and agreements. Prices are indicative only. All shares prices are delayed by at least 20 mins.
