Falling and rising wedge chart patterns: a trader's guide
Wedges can offer an invaluable early warning sign of a price reversal or continuation. Learn all about the falling wedge pattern and rising wedge pattern here, including how to spot them, how to trade them and more.

What is the rising wedge chart pattern?
The rising wedge chart pattern is a recognisable price move that’s formed when a market consolidates between two converging support and resistance lines. To form a rising wedge, the support and resistance lines both have to point in an upwards direction and the support line has to be steeper than resistance.
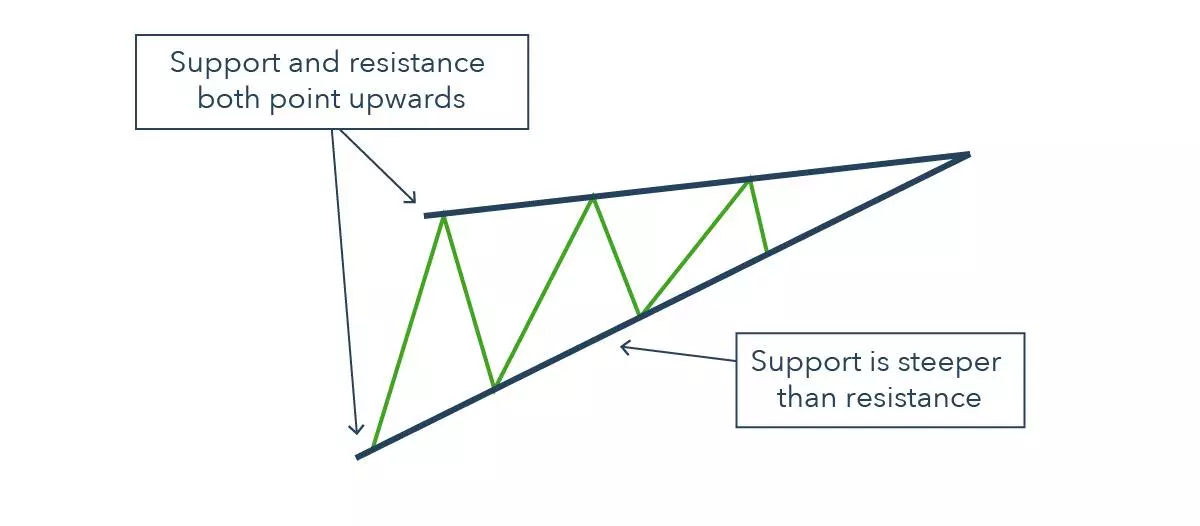
Like head and shoulders, triangles and flags, wedges often lead to breakouts. In the case of rising wedges, this breakout is usually bearish.
Ascending wedges can occur when a market is rising or falling:
- When a market is in an uptrend, they’re a sign that traders are reconsidering the bull move
- When a market is falling, they’re a short-term pause before the bear market takes hold once more
At first glance, an ascending wedge looks like a bullish move. After all, each successive peak and trough is higher than the last. But the key point to note is that the upward moves are getting shorter each time. This is the sign that bearish opinion is forming (or reforming, in the case of a continuation).
This negative sentiment builds up, so that when the market moves beyond its rising support line, anyone with a long position might rush to close their trade and limit their losses. Those waiting to short the market, meanwhile, will jump in. This causes a tide of selling that leads to significant downward momentum.
Rising wedges can occur on any market that’s popular with technical traders, including indices, forex and stocks.
Open an IG account to start trading them now.
What is the falling wedge chart pattern?
The falling wedge chart pattern is a recognisable price move that is formed when a market consolidates between two converging support and resistance lines. To form a descending wedge, the support and resistance lines have to both point in a downwards direction and the resistance line has to be steeper than the line of support.
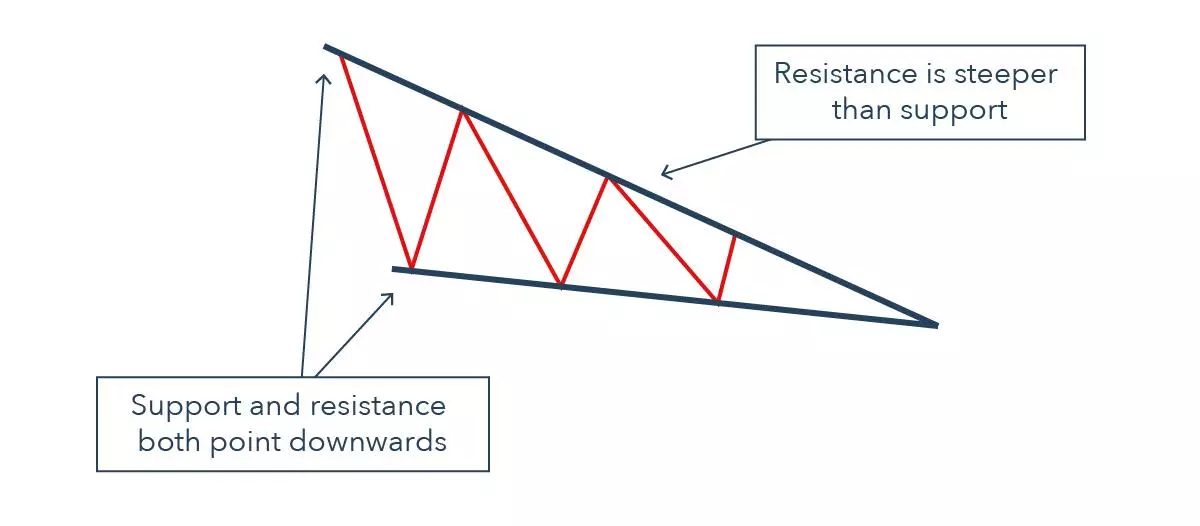
A falling wedge is essentially the exact opposite of a rising wedge. So it also often leads to breakouts – but while ascending wedges lead to bearish moves, downward ones lead to bullish moves.
- When a market is on an uptrend, they represent a short-term pause before the long-term move takes hold once more
- When a market is falling, they’re a sign that traders are reconsidering the bear move
As with their counterpart, the rising wedge, it may seem counterintuitive to take a falling market as a sign of a coming bull move. But in this case, it’s important to note that the downward moves are getting shorter and shorter. This is a sign that bullish opinion is either forming or reforming.
Studies have shown that falling wedges lead to breakouts slightly more often than rising ones. To spot them, though, you’ll need a platform with powerful charting tools: such as the IG trading platform or MetaTrader 4.
You can try out the IG trading platform with a demo account.
Rising wedge vs falling wedge: what’s the difference?
| Rising wedge | Falling wedge |
| Made when support and resistance lines converge upwards | Made when support and resistance lines converge downwards |
| The support line has to be steeper than resistance | The resistance line has to be steeper than support |
| Taken as a sign of an upcoming bear market | Taken as a sign of an upcoming bull market |
Strategies to trade wedge patterns
To design your wedge trading strategy, you’ll need to decide when to open your position, when to take profit and when to cut your losses.
Opening your position
Not all wedges will end in a breakout – so you’ll want to confirm the move before opening your position.
One way to confirm the move is to wait for the breakout to start. Essentially, here you are hoping for a significant move beyond the support trendline for a rising wedge, or resistance for a falling one.
For ascending wedges, for example, traders will often watch out for a move beyond a previous support point. Alternatively, you can use the general rule that support turns into resistance in a breakout, meaning the market may bounce off previous support levels on its way down. As a result, you can wait for a breakout to begin, then wait for it to return and bounce off the previous support area in the ascending wedge. This will enable you to ensure that the move is confirmed before opening your position.
Another common signal of a wedge that’s close to breakout is falling volume as the market consolidates. A spike in volume after it breaks out is a good sign that a bigger move is on the cards.
Taking profit
Here, we can again turn to two general rules about trading breakouts. The first is that previous support levels will become new levels of resistance, and vice versa.
Say ABC stock hits $65, $55 and $45 as the peaks in its descending wedge. These resistance points may become areas of support in its next move up.
The second is that the range of a previous channel can indicate the size of a subsequent move. In this case, it’s often the gap between the high and low of the wedge at its outset. If a rising wedge begins with support and resistance 100 points apart, the market may then fall 100 points once the breakout is confirmed.
Cutting losses
One advantage of trading any breakout is that it should be clear when a potential move has been invalidated – and wedge trading is no different. Let’s take a look at a rising wedge as an example.
Say EUR/USD breaks below the support line on its wedge, but then rallies and hits a new higher high. Both lines have now been surpassed, meaning that the pattern has broken. So by placing a stop loss at the previous market high, you can close the trade before further losses are incurred.
Alternatively, you could place a stop loss a little above the previous level of support. Then, if the previous support fails to turn into a new resistance level, you close your trade.
Rising wedge example: Russell 2000

In early 2018, the Russell 2000 index entered into a wedge that precipitated the end of a long bull market. Trading consolidated between two lines that edged ever closer to each other, but shortly before the lines met the index broke below support and began a bear run.
Note how the index found support at 1600 on its upward move, which became an area of resistance in its subsequent downward breakout – and how the initial breakout roughly matches the range of the wedge.
How to start trading wedges
- Learn the principles of technical trading at IG Academy
- Sign up for a live account to buy and sell thousands of indices, shares, currency pairs and more
- Identify wedges using our comprehensive charting tools
- Open your position
Not quite ready to trade with real capital? Open an IG demo to trial your wedge strategy with £10,000 in virtual funds.
Falling and rising wedge patterns summed up
- Wedges are a technical pattern that traders use to identify upcoming bull and bear markets
- Falling wedges often lead to bull markets, while rising wedges often lead to bear markets
- To trade them you’ll need to decide where to open your position, take profit and cut losses
- You can learn more about wedges – and other chart patterns – at IG Academy
This information has been prepared by IG, a trading name of IG Markets Ltd and IG Markets South Africa Limited. In addition to the disclaimer below, the material on this page does not contain a record of our trading prices, or an offer of, or solicitation for, a transaction in any financial instrument. IG accepts no responsibility for any use that may be made of these comments and for any consequences that result. No representation or warranty is given as to the accuracy or completeness of this information. Consequently any person acting on it does so entirely at their own risk. Any research provided does not have regard to the specific investment objectives, financial situation and needs of any specific person who may receive it. It has not been prepared in accordance with legal requirements designed to promote the independence of investment research and as such is considered to be a marketing communication. Although we are not specifically constrained from dealing ahead of our recommendations we do not seek to take advantage of them before they are provided to our clients. See full non-independent research disclaimer and quarterly summary.

Explore the markets with our free course
Discover the range of markets you can spread bet on - and learn how they work - with IG Academy's online course.