Best position trading strategies
Position trading can be a great way to take up long-term positions on stocks and other assets. However, occupying a position for a long time, while having a greater potential for profit, also increases the inherent risk.

What is position trading and how does it work?
Position trading involves keeping a position open for a long period of time. As a result, a position trader is less concerned with short-term market fluctuations, and usually holds a position for weeks, months or years.
Position trading can refer to either speculating on price or investing. Investing is the most common form of position trading, with many position traders having long-term investments in share portfolios, funds or pension plans. However, investing is limited to going long, while position trading with CFDs can also involve going short.
Often, position traders use fundamental analysis and technical analysis to evaluate potential market trends and risks before opening a position. The strategies below can be used by position traders to analyse price charts and make predictions about market movements.
Support and resistance trading strategy
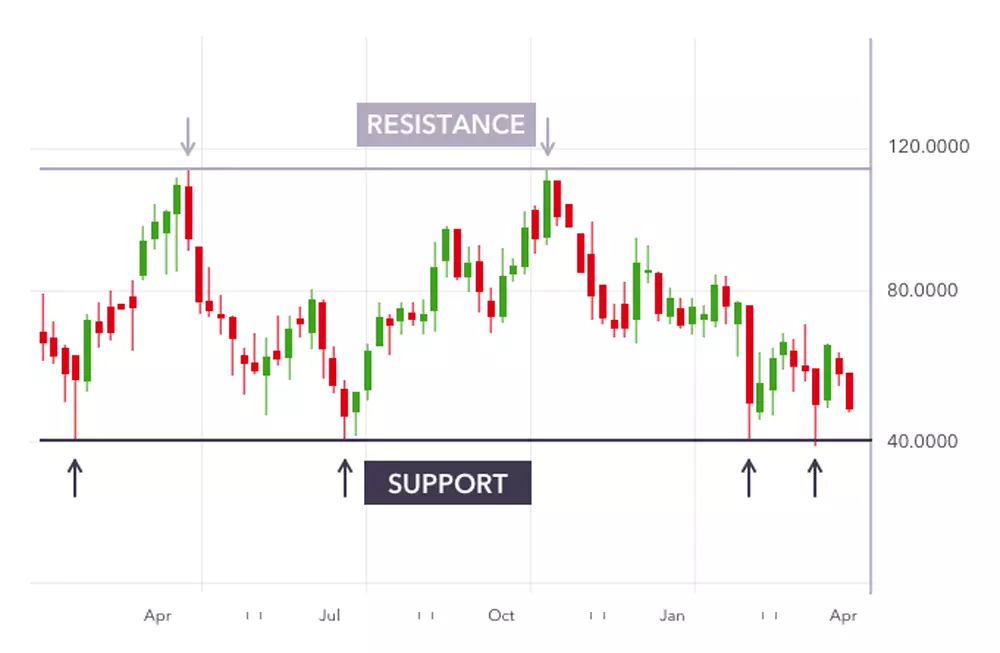
Support and resistance levels help position traders recognise when an asset’s price movement is more likely to fall into a downward trend or increase into an upward trend. Based on their assessment, position traders can decide whether to open or close their position on a particular asset.
A support level is the price an asset will not usually fall below, as buyers tend to purchase the asset at this level. Conversely, the resistance level is the point at which the price of an asset ceases to rise. In this scenario, traders may choose to close their position and take the profit instead of maintaining their position, only for the price to fall.
A support and resistance trading strategy enables traders to analyse chart patterns – a useful skill for a position trader to have if they are to take up long-term positions on certain assets.
There are three main factors to consider when trying to identify support and resistance levels.
- The historical price is the most reliable source for identifying support and resistance levels. Normally, periods of significant gains and reductions in price will be used as notable indicators of future movements
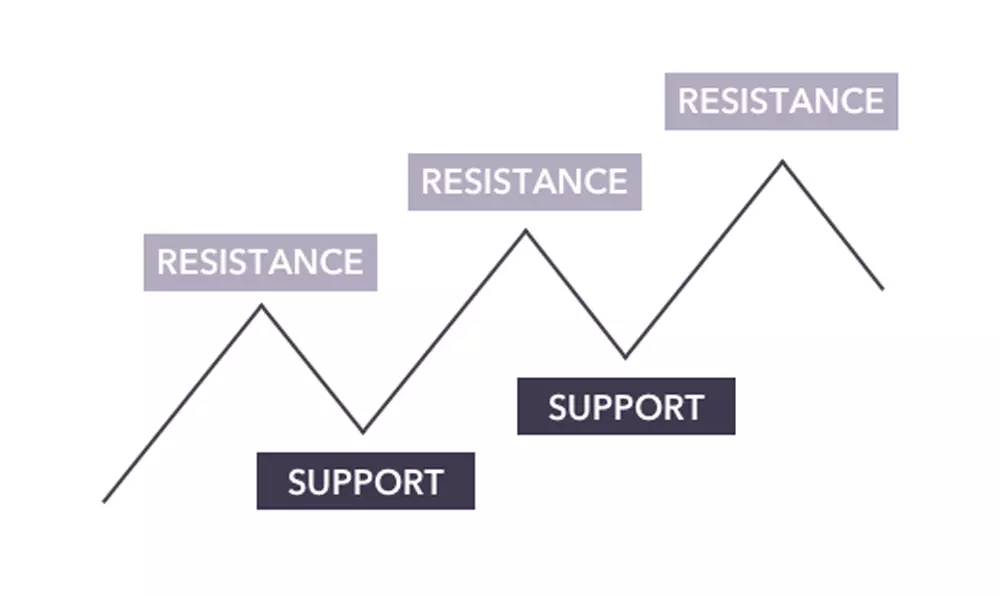
- Similarly, position traders can look at previous levels of support and resistance as an indicator of future movements. For example, if a support level is broken it could turn into a resistance level for future trades
- Finally, technical indicators, such as the Fibonacci retracements explained below, provide dynamic support and resistance levels which change with the price of a given asset
Breakout trading strategy
Breakout trading involves trying to occupy a position in the early stages of a trend. Usually, a breakout strategy forms the foundation for trading large-scale price movements.
A breakout trader will open a long position after the stock price breaks above the resistance level, or will enter a short position after the stock falls below the support level. To be a successful breakout trader, you need to be comfortable identifying periods of market support and resistance.
Range trading strategy
Range trading is a strategy which works best in a market that is constantly shifting up and down. Forex traders particularly benefit from range trading because forex markets don’t always have a clear and obvious trend.
A range trading strategy is best utilised by a trader who has identified overbought and oversold assets. The aim is to buy the oversold assets and sell the overbought ones. In this instance, an ‘oversold asset’ is one approaching the support level, while an ‘overbought asset’ is one approaching the resistance level.
Pullback and retracement trading strategy
A pullback is a temporary dip or brief reversal in an asset’s prevailing upward trend. Pullback trading can enable traders to capitalise on these dips or pauses in the upward movement of an asset’s price. The aim is to buy low and sell high once the asset moves out of the pullback and continues its upward trend.
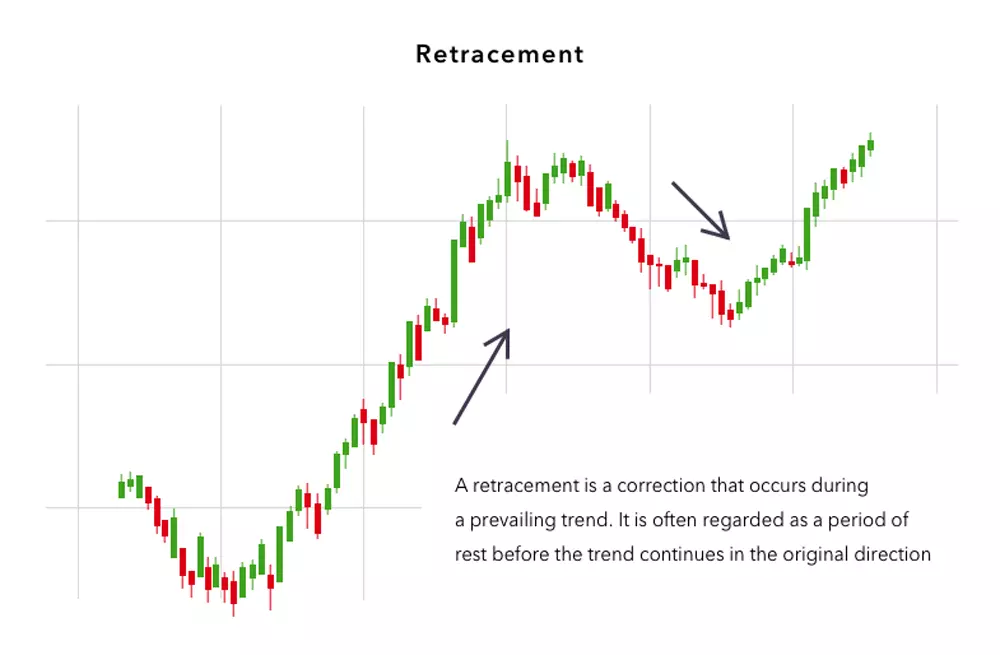
Pullbacks are sometimes referred to as retracements, but should not be confused with reversals. Reversals tend to be long-term or permanent deviations from the prevailing trend.
One way to determine whether a market dip is a pullback or a reversal is to utilise a Fibonacci retracement.
How do position traders use a Fibonacci retracement?
A Fibonacci retracement is form of technical analysis which can help position traders decide when to open and close a position.
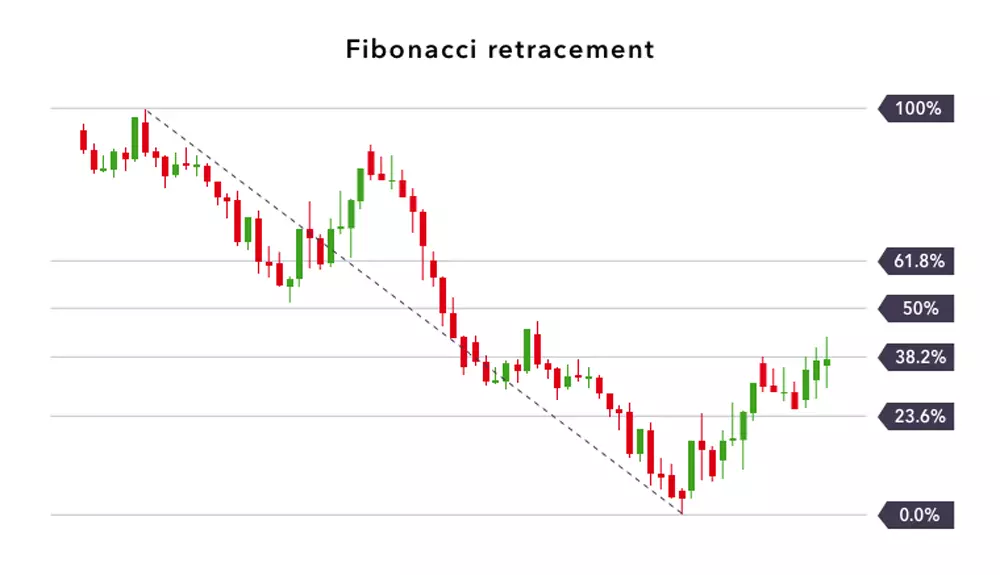
To calculate Fibonacci retracements, position traders draw six lines across an asset’s price chart. The first line goes at 100%, the next at 50%, and then one line at 0%. After this, position traders will draw three additional lines at 61.8%, 38.2% and 23.6%.
In theory, these percentages adhere to the golden ratio, which can be used in this instance as a key for where levels of support and resistance can be identified. It is at these points that position traders may choose to open or close a position.
Conclusion
Position trading sounds simple, but it involves carrying out detailed fundamental and technical analysis, as well as a thorough understanding of the markets. Here are some key points to keep in mind for each strategy:
- Support and resistance levels help position traders recognise when an asset’s price movement is more likely to reverse into a downward trend or increase into an upward trend. The support is the price an asset will not usually fall below, and the resistance is the point at which the price of an asset tends to stop rising
- Breakout trading is a good strategy to use in the early stages of a trend, but spotting trading opportunities requires traders to be comfortable identifying periods of market support and resistance
- Range trading is best used in markets which move up and down with no obvious trend, such as some forex markets
- A pullback trading strategy can enable position traders to buy low and sell high, so long as an asset’s price recovers after a temporary dip, instead of progressing to a more permanent reversal
This information has been prepared by IG, a trading name of IG Markets Ltd and IG Markets South Africa Limited. In addition to the disclaimer below, the material on this page does not contain a record of our trading prices, or an offer of, or solicitation for, a transaction in any financial instrument. IG accepts no responsibility for any use that may be made of these comments and for any consequences that result. No representation or warranty is given as to the accuracy or completeness of this information. Consequently any person acting on it does so entirely at their own risk. Any research provided does not have regard to the specific investment objectives, financial situation and needs of any specific person who may receive it. It has not been prepared in accordance with legal requirements designed to promote the independence of investment research and as such is considered to be a marketing communication. Although we are not specifically constrained from dealing ahead of our recommendations we do not seek to take advantage of them before they are provided to our clients. See full non-independent research disclaimer and quarterly summary.

Explore the markets with our free course
Discover the range of markets you can spread bet on - and learn how they work - with IG Academy's online course.