US holiday to bring quieter start to the week, Chinese equities in focus: Russell 2000, USD/JPY, Brent crude
The US jobs data release last Friday displayed signs of softening in the US labour market, while Wall Street continues to catch a breather from its recent rally.


Market Recap
The US jobs data continues to reflect signs of softening in the US labour market, which seems to be in line with the Federal Reserve (Fed) aim. Job additions were somewhat lukewarm despite being slightly higher than consensus (187,000 versus 170,000 forecast), while unemployment rate jumped to 3.8% from previous 3.5%. Along with some moderation in wage growth, rate expectations found validation for the Fed to keep rates on hold this month, with 62% probability being priced for the November meeting.
Treasury yields were higher however , with the two-year yields paring earlier losses while the ten-year is up 7 basis-point (bp), overall lifting the US dollar. This comes as US Institute for Supply Management (ISM) manufacturing purchasing managers index (PMI) data may support rates to be keep high for longer by displaying a lesser-than-expected contraction in manufacturing prices (48.4 versus 43.9 forecast).
Wall Street was little changed, somewhat catching a breather from its recent rally, with US markets offline today due to Labour Day holiday. The US holiday may bring about lighter trading volume across the globe and set the stage for a quieter start to the week. Attention will then be turned to China’s Caixin PMI data and the Reserve Bank of Australia (RBA) interest rate decision tomorrow, along with retail sales figure in Singapore.
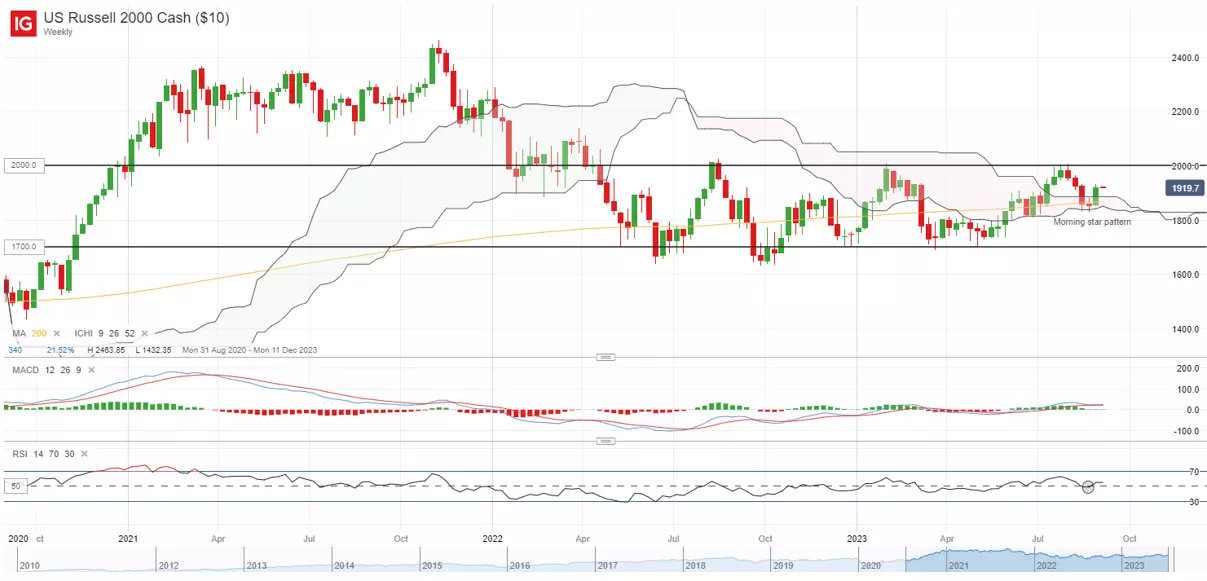
Perhaps one to watch is the Russell 2000 index, which is up 3.4% for the week. On the weekly chart, a morning star formation seems to be in place, while its relative strength index (RSI) attempts to defend its key 50 level last week. This follows after a retest of the lower edge of its Ichimoku cloud pattern on the weekly chart, which has supported prices for the second occasion since May this year. Staying above its 200-day moving average (MA) may keep the near-term bias intact, with immediate support at the 1,900 level. On the upside, the key psychological 2,000 level will serve as key resistance to overcome.
Asia Open
Asian stocks look set for a positive open, with Nikkei +0.32%, ASX +0.71% and KOSPI +0.19% at the time of writing. The Nasdaq Golden Dragon China Index was up 3.2% last Friday, digesting the recent fresh moves from China authorities to support the Chinese Yuan (CNY) and its housing market. China’s financial regulators have cut the down-payment requirements for first and second-time home buyers and lowered rates on existing mortgages – a move to provide some support for home sales demand as a bid to restore confidence, although much still awaits on how much impact it may eventually have.
On another front, Country Garden’s recent success in buying time from its creditors for its 3.9 billion yuan onshore private bond could provide some support for Chinese equities to start the week, although past lessons from China Evergrande suggests that any extension could be just a near-term reprieve, with the lack of an eventual resolution still a headwind for risk sentiments eventually.
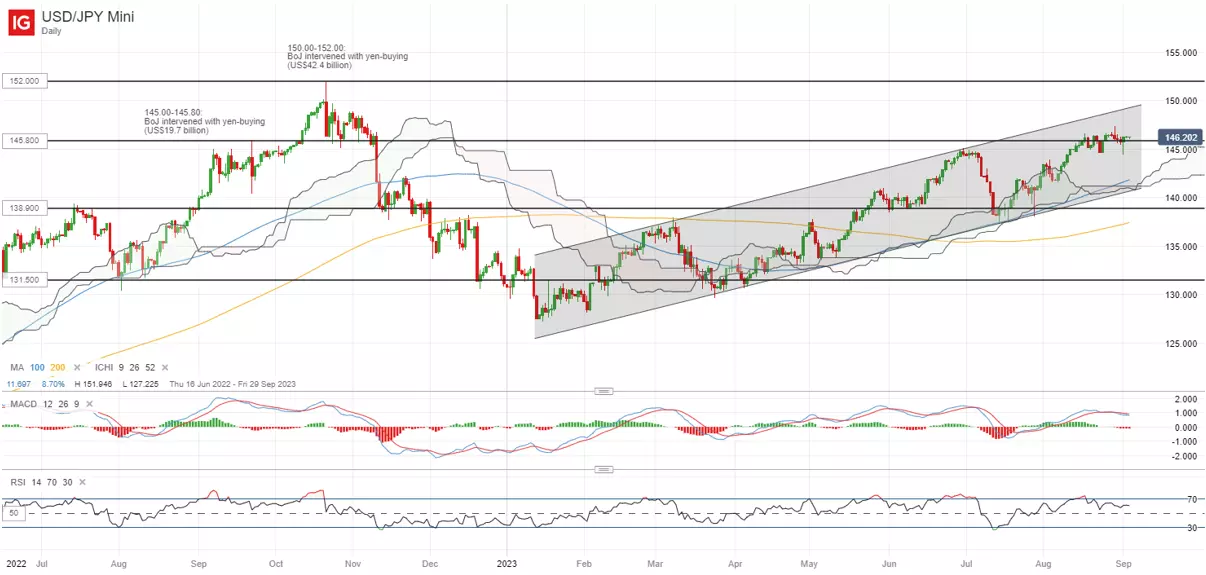
Aside, one to watch may be the USD/JPY, which saw the formation of a bullish hammer on the daily chart last Friday to defend the key 145.80 level. This level marked a crucial level of intervention by the Bank of Japan (BoJ) in September last year, with the dip-buying in place reflecting some expectations for the US-Japan yield differentials to be well-supported by policy divergence. A move above last Tuesday’s high may potentially support a move to retest the 148.80 level next, while on the downside, the 145.00-145.80 range will remain a key level of support for buyers to hold.
On the watchlist: Brent crude prices setting its sight for new year-to-date high
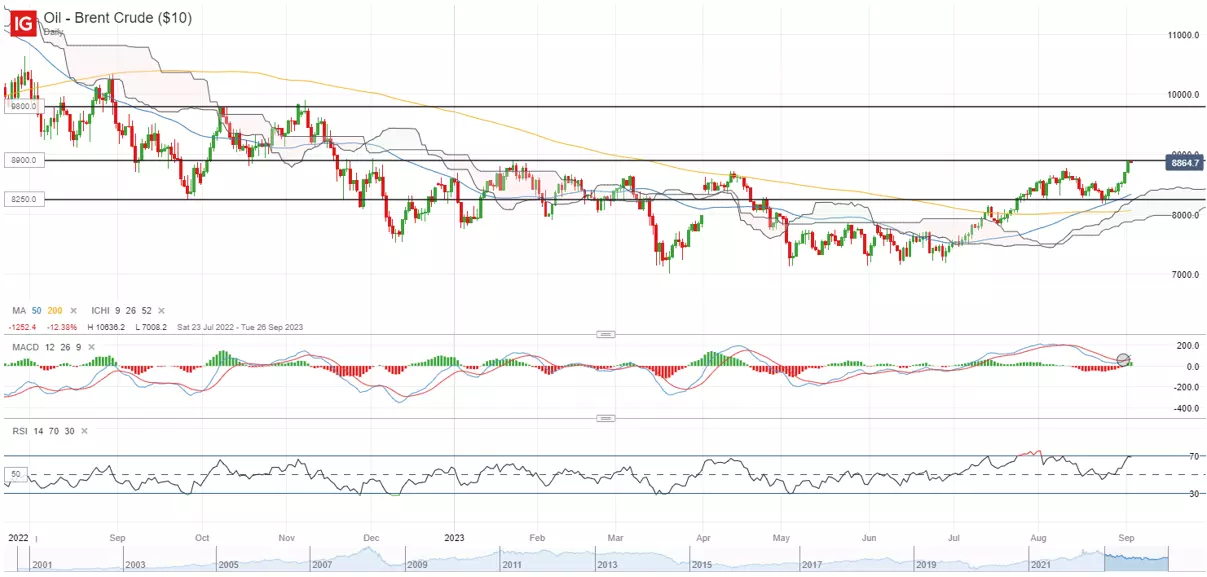
Brent crude prices continue to climb last Friday (+2.1%), shrugging off the stronger US dollar to stand just less than 1% away from a new year-to-date high. For the week, prices are up 5.5% - its best week since April this year. Declining inventories in the US, along with further output cuts expected out of Russia, continues to underpin a tightening supply outlook while on the technical front, prices continue to trend above its 200-day MA.
A bullish crossover was formed on its moving average convergence/divergence (MACD) on the daily chart last week, overall supporting some build-up in positive momentum. Further upside may leave the US$98.00 level on watch for a retest next, which marked its October and November 2022 highs.
Friday: DJIA +0.33%; S&P 500 +0.18%; Nasdaq -0.02%, DAX -0.67%, FTSE +0.34%
This information has been prepared by IG, a trading name of IG Markets Ltd and IG Markets South Africa Limited. In addition to the disclaimer below, the material on this page does not contain a record of our trading prices, or an offer of, or solicitation for, a transaction in any financial instrument. IG accepts no responsibility for any use that may be made of these comments and for any consequences that result. No representation or warranty is given as to the accuracy or completeness of this information. Consequently any person acting on it does so entirely at their own risk. Any research provided does not have regard to the specific investment objectives, financial situation and needs of any specific person who may receive it. It has not been prepared in accordance with legal requirements designed to promote the independence of investment research and as such is considered to be a marketing communication. Although we are not specifically constrained from dealing ahead of our recommendations we do not seek to take advantage of them before they are provided to our clients. See full non-independent research disclaimer and quarterly summary.

Seize a share opportunity today
Go long or short on thousands of international stocks.
- Increase your market exposure with leverage
- Get spreads from just 0.1% on major global shares
- Trade CFDs straight into order books with direct market access
Live prices on most popular markets
- Forex
- Shares
- Indices
Prices above are subject to our website terms and agreements. Prices are indicative only