Subdued showing in Asia, as initial rally in Wall Street fizzles overnight: Gold, Straits Times Index, GBP/USD
An initial rally in Wall Street eventually fizzled into the close, as Treasury yields headed higher in the aftermath of the US CPI release, prompting the US dollar to pare its earlier losses.


Market Recap
An initial rally in Wall Street eventually fizzled into the close, as Treasury yields headed higher in the aftermath of the US Consumer Price Index (CPI) release, prompting the US dollar to pare its earlier losses.
Both headline and core US CPI surprised on the downside, which will likely provide grounds for the Fed to keep rates on hold in September, but with Fed funds rate expectations already priced heavily for an end to the Fed’s tightening process, some selling on the bounce seems to be triggered. The real-time daily inflation estimates from the Cleveland Fed also suggests that US headline inflation may continue to pull ahead further this month, which will likely keep the Fed on their toes.
For now, the US core CPI has ticked lower to 4.7% versus the 4.8% expected. On the other hand, headline inflation has seen its first increase since August 2022, rising to 3.2% from previous 3% (consensus 3.3%) on higher energy costs. Month-on-month, both registered an expected 0.2% increase.
The day ahead will leave US producer prices and consumer sentiment data on watch. A similar story is expected for US headline producer prices to reveal a 0.7% increase year-on-year from previous 0.1%, while the core aspect is expected to tick slightly lower to 2.3% from previous 2.4%. Given the lukewarm reaction to the recent CPI data, it seems that some market indecision is in place, with one to watch if market sentiments will turn to selling the bounce once more.
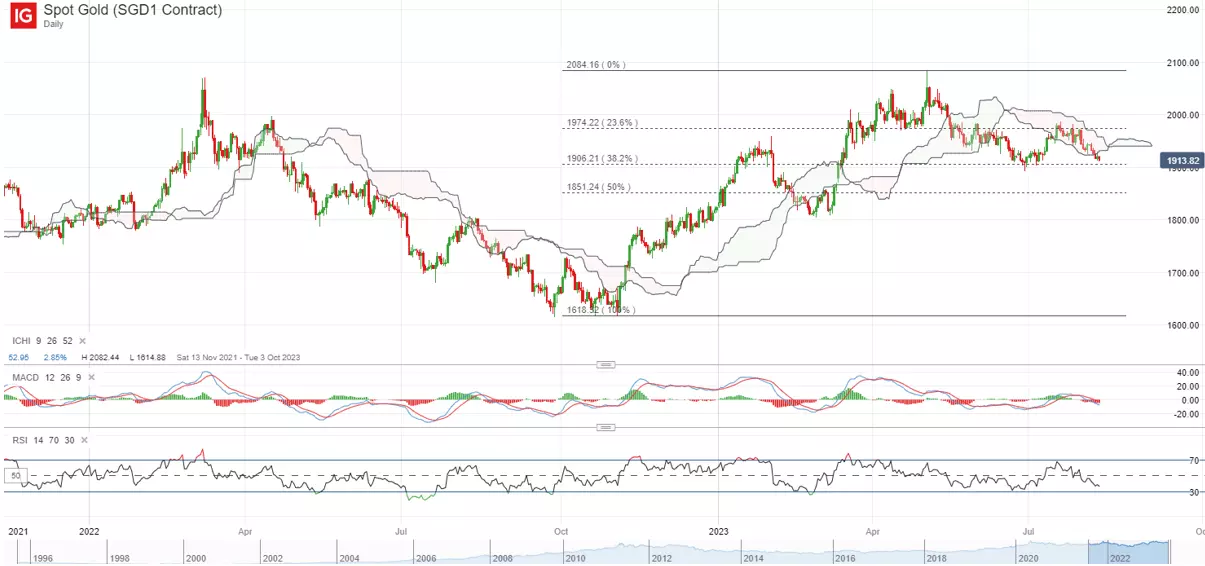
Higher yields have not been well-received by gold prices, which continues to head lower to its one-month low overnight after treading in its Ichimoku cloud resistance over the past weeks. The US$1,900 level may have to see some defending ahead, with previous dip-buying efforts sighted at this level. Its relative strength index (RSI) on the weekly chart is also back at its key 50 level, with any failure to defend the 50-mark potentially indicating a wider trend reversal to the downside.
Asia Open
Asian stocks look set for a subdued open, with ASX -0.15% and KOSPI +0.07% at the time of writing. Japan markets are closed today due to holiday. The pocket of relief may come from the release of Alibaba’s results yesterday, which reflected a more resilient showing with a top and bottom-line beat. The Nasdaq Golden Dragon China Index is up 0.7%, but given that a recovery in China’s economic conditions still lacks conviction at current point in time, traction towards Chinese equities could remain more lukewarm.
This morning, Singapore’s final estimates for Q2 GDP has registered a softer read of 0.1% growth quarter-on-quarter (initial estimate: 0.3%), which may dampen previous optimism and continue to highlight the challenges in the manufacturing sector from a weak external demand outlook. More notably, the Ministry of Trade and Industry (MTI) has narrowed its GDP growth forecast for this year to ‘0.5% to 1.5%’ from the previous ‘0.5% to 2.5%’, which puts in place a more subdued growth picture through the rest of the year.
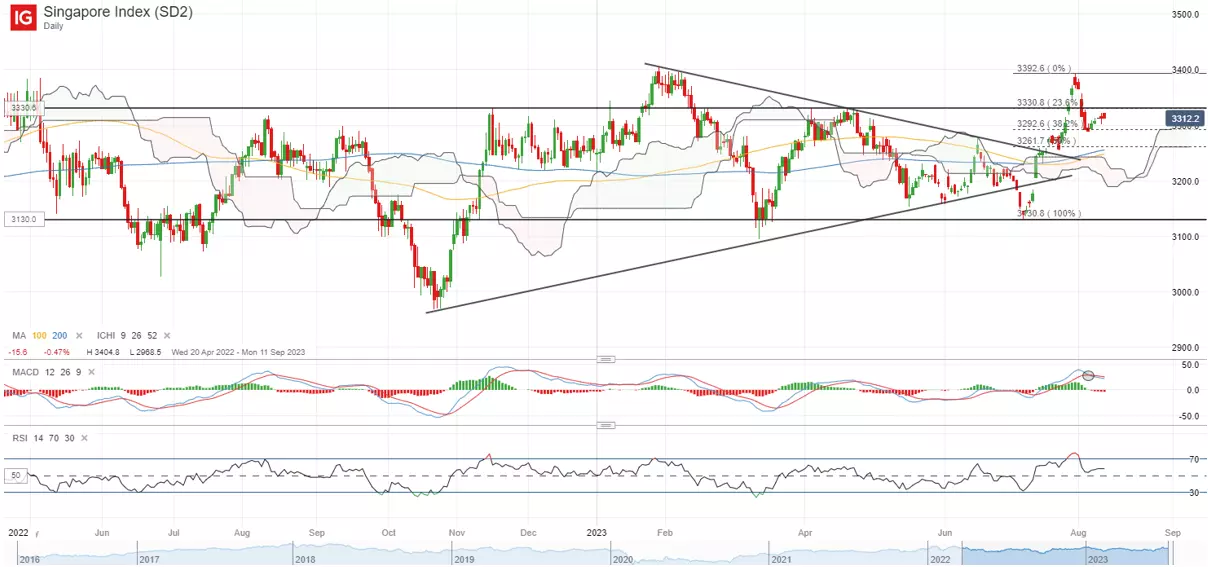
With the local banks’ results behind us, the Straits Times Index will have to seek out other catalyst in order to sustain its recent rally. Recent attempt to bounce off a 38.2% Fibonacci retracement level seems to reflect some lingering caution with more measured green candles. The 3,330 level will be an immediate resistance to overcome ahead, while on the downside, its recent low at the 3,287 level will be one to watch.
On the watchlist: GBP/USD heads below trendline support
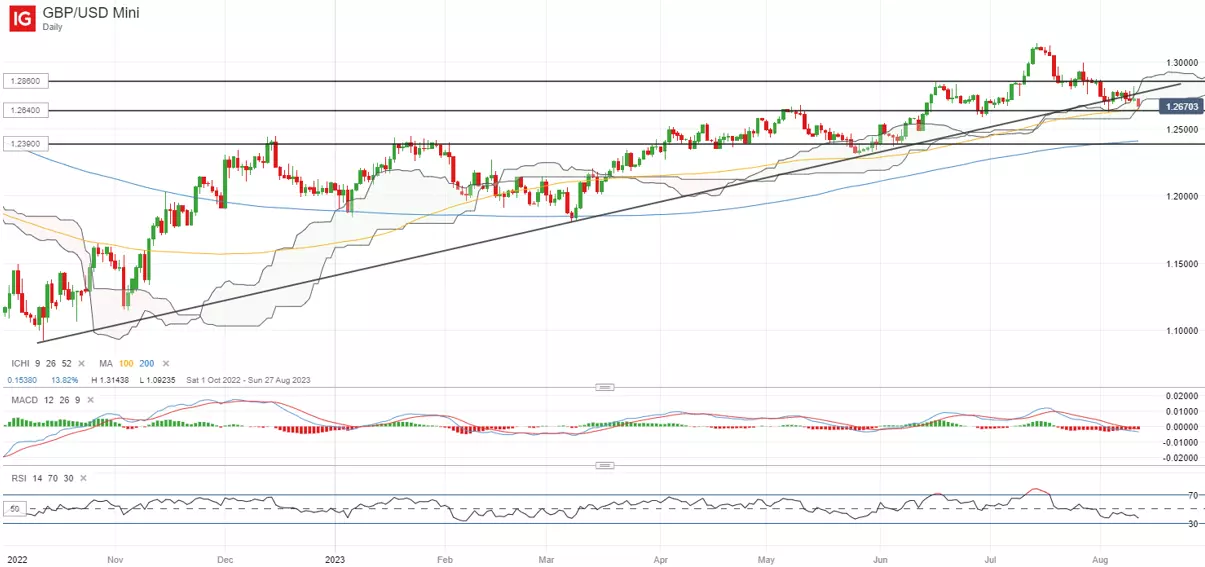
Ahead of the UK GDP release, the GBP/USD has failed to hold above an upward trendline support in place since October last year, with dragged lower by a stronger US dollar lately. This has brought the pair back to retest a support confluence at the 1.264 level, where the lower edge of its Ichimoku cloud on the daily chart coincides with its 100-day moving average (MA). Breaking below the 1.264 level may potentially pave the way to retest the 1.239 level next.
The upcoming UK Q2 GDP data is expected to turn in a 0.2% growth, unchanged from Q1, which will suggest that the UK economy has managed to steer clear of a recession for now. Monthly GDP is expected to register a 0.5% year-on-year growth for June. But given that the Bank of England (BoE) is expected to push on with further tightening over the coming months, downside risks to growth conditions persist. Any weaker-than-expected GDP read ahead may challenge views of a more aggressive BoE and weigh on the pair further.
Thursday: DJIA +0.15%; S&P 500 +0.03%; Nasdaq +0.12%, DAX +0.91%, FTSE +0.41%
This information has been prepared by IG, a trading name of IG Markets Ltd and IG Markets South Africa Limited. In addition to the disclaimer below, the material on this page does not contain a record of our trading prices, or an offer of, or solicitation for, a transaction in any financial instrument. IG accepts no responsibility for any use that may be made of these comments and for any consequences that result. No representation or warranty is given as to the accuracy or completeness of this information. Consequently any person acting on it does so entirely at their own risk. Any research provided does not have regard to the specific investment objectives, financial situation and needs of any specific person who may receive it. It has not been prepared in accordance with legal requirements designed to promote the independence of investment research and as such is considered to be a marketing communication. Although we are not specifically constrained from dealing ahead of our recommendations we do not seek to take advantage of them before they are provided to our clients. See full non-independent research disclaimer and quarterly summary.

Seize a share opportunity today
Go long or short on thousands of international stocks.
- Increase your market exposure with leverage
- Get spreads from just 0.1% on major global shares
- Trade CFDs straight into order books with direct market access
Live prices on most popular markets
- Forex
- Shares
- Indices
Prices above are subject to our website terms and agreements. Prices are indicative only