Is the BP share price likely to outperform post Q4 earnings?
Does the BP share price dip represent a buying opportunity ahead of Q4 results?
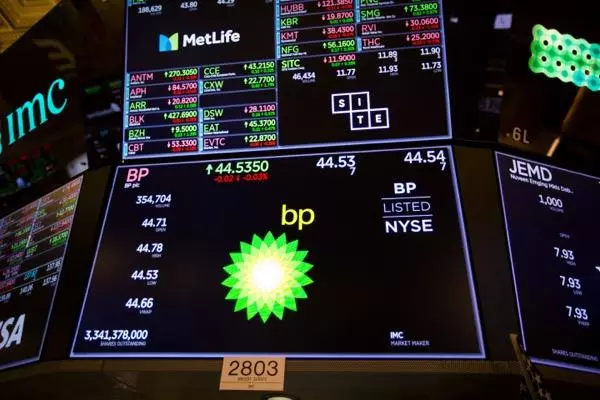

Is BP still a good investment?
With the BP share price having risen by around 25% last year on the back of surging oil and gas prices due to the nearly one-year old invasion of Ukraine by Russia, is the stock likely to continue to outperform, now that energy prices have come off significantly over the last few months?
BP’s fourth quarter (Q4) 2022 results on 07 February 2023 might help investors answer this question. The results are for the fiscal quarter ending December 2022.
What is ‘The Street’s’ expectation for the Q4 2022 results?
According to Refinitiv expectations for the upcoming results are as follows:
Revenue of $45,787 billion : -9.43% year on year (YoY)
Earnings per share (EPS): $0.23 (+9.5% YoY)
How to trade BP into the results
According to Refinitiv, six analysts rate BP as a ‘strong buy’, twelve as a ‘buy’ and eight as a ‘hold’ with a median price target of 550p, some 14% above current levels (as of 3 February 2023).

With the share price mimicking the FTSE 100 year-to-date performance of just under 1%, versus over 6.5% for the STOXX Europe 600, for example, the question is whether the BP share price can replicate its outperformance versus its peers within the FTSE 100 for a third year in a row or whether falling energy prices will hurt its share price.
The British oil and gas company has changed tack with regards to its green investments at a time when it can maximise profits amid booming demand for fossil fuels and may thus not achieve its long-term ambition to hit net zero by 2050.
Its CEO, Bernard Looney, wants to “dial back” BP’s investments into clean energy since the returns on renewables, such as wind and solar, have been miniscule when compared to the company’s record profits from fossil fuels, thus keeping shareholders on its side.
Despite BP’s share price having risen significantly over the past couple of years, how did the world’s 20th largest energy company, behind Shell in ninth, Exxon Mobil in fourth and Saudi Arabian Oil Co in first position, fare versus its larger rivals?
Google Finance energy companies share price comparison

As can be seen from the above chart, BP can hold its head high as it has risen by over 25% from a year ago, slightly ahead of its rival Shell and by considerably more than the world’s largest oil company, Saudi Arabian Oil Co, which remains in negative territory at -2.5%.
Only Exxon Mobil, which last year reaped a record $55.7bn (£45.2bn) profit, outperformed with its share price rising by 43% since February of 2022.
What does the technical outlook say about the BP share price?
When analysing a weekly BP chart going back to 2020, it becomes clear that the share is trading within a clearly defined uptrend channel but has been trading sideways since it made its 504.40 pence October 2022 10-month high, as oil and gas prices have come off their lofty heights.

Even if the share price hasn’t gotten anywhere over the past three plus months, the daily chart is still showing a series of higher lows which is encouraging for the bulls.
Last week the BP share price slid back to but straight away bounced off the 55-day simple moving average (SMA) at 478.30p but now needs to exceed the November-to-February highs at 496.65 to 504.40 on a daily chart closing basis for the bulls to once more take control.
A rise above 504.40p would engage the 508.45p January 2020 high, followed by the October and November 2019 peaks at 518.50p to 521.50p. These upside targets should remain in view while the BP share price stays above its 455p December low on a daily chart closing basis.
Above this level, the July-to-February support line can be seen at 474.85p and the late January low at 468.60p. While the latter level underpins, an immediate upside bias should remain in play.

This information has been prepared by IG, a trading name of IG Markets Ltd and IG Markets South Africa Limited. In addition to the disclaimer below, the material on this page does not contain a record of our trading prices, or an offer of, or solicitation for, a transaction in any financial instrument. IG accepts no responsibility for any use that may be made of these comments and for any consequences that result. No representation or warranty is given as to the accuracy or completeness of this information. Consequently any person acting on it does so entirely at their own risk. Any research provided does not have regard to the specific investment objectives, financial situation and needs of any specific person who may receive it. It has not been prepared in accordance with legal requirements designed to promote the independence of investment research and as such is considered to be a marketing communication. Although we are not specifically constrained from dealing ahead of our recommendations we do not seek to take advantage of them before they are provided to our clients. See full non-independent research disclaimer and quarterly summary.

Take a position on indices
Deal on the world’s major stock indices today.
- 1-point spread on the FTSE 100 and Germany 40
- The only provider to offer 24-hour pricing
Live prices on most popular markets
- Forex
- Shares
- Indices
Prices above are subject to our website terms and agreements. Prices are indicative only