


See more forex live prices
News and trade ideas

See it and
seize it
Introducing Explore - a mobile news and analysis centre. Stay informed and engaged with top news, analyst articles, videos, and more.
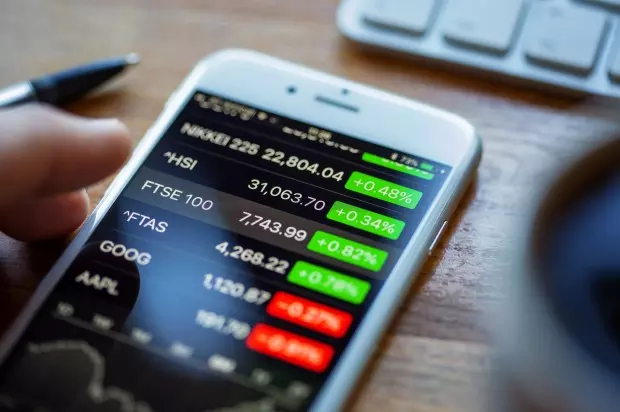
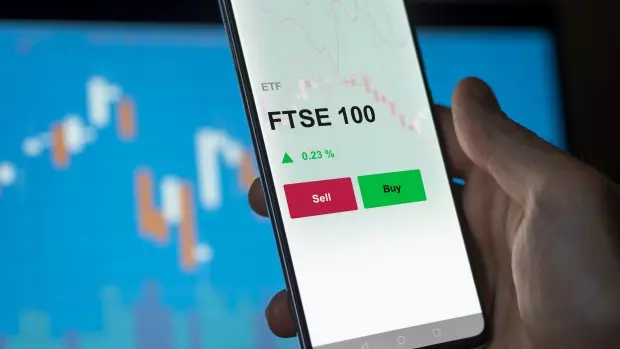
Live prices on most popular markets
- Forex
- Shares
- Indices
Prices above are subject to our website terms and agreements. Prices are indicative only. All shares prices are delayed by at least 15 mins.
Tweets by @ChrisB_IG


You might be interested in…
Discover opportunities in a huge variety of financial markets
Discover why so many clients choose us, and what makes us a world-leading provider of spread betting and CFDs.
Find out what charges your trades could incur with our transparent fee structure.