How far can the CAC 40, DAX 40 and FTSE 100 rise?
Outlook for the CAC 40, DAX 40 and FTSE 100 amid a hawkish Fed and ECB.


Can European equity indices rise further still?
Persistently strong US employment data and sticky inflation, both in the US and across the pond in Europe, have taken the wind out of this year’s strong equity market rally but haven’t as yet provoked a major sell-off either.
This weeks’ Federal Reserve (Fed) Chair Jerome Powell’s semi-annual testimony before Congress in which he said that the central bank is “prepared to increase the pace of interest rate hikes” if the data required it but that no decision on the March meeting had been taken yet, led to US equity markets selling off quite substantially but to a lesser degree their European counterparts, most of which trade in year highs.
The CAC 40, for example, briefly made a new all-time record high while the German DAX 40 rose to levels last seen in February 2022 before they were both dragged down by hawkish comments, not just out of the US, but also from the European Central Bank (ECB) President Christine Lagarde with a 50-basis point rate hike to 3.5% at next week’s monetary committee meeting looking like a done deal.
The real question is what monetary policy will be like beyond the March meeting next Thursday and whether Europe will continue to suffer from stagnating economies amid persistently high inflation and how the ECB will deal with such a scenario.
The hawks will likely argue for further aggressive rate hikes in order to bring inflation down whereas the doves may want to see a pause in the hiking cycle in order to gauge the impact recent rate hikes have so far had on European economies and to make sure that these don’t get pushed into a recession.
Friday’s US Non-Farm Payrolls and next week’s US consumer inflation, producer price and retail sales data may take the lead, though, as to the future direction most global equity markets may be taking.
Unless data show that inflation remains sticky, or even rises again, and there is a clear shift by financial markets with regards to their medium-term macro-economic outlook, the last couple of months’ ‘buying the dip mentality’ - especially in regards to European equity markets - is likely to prevail with further upside potentially being seen.
This has led to European equity indices outperformance over the past six months with several major European indices, except the FTSE 100, trading in double-digit positive territory while most US indices remain in negative territory.
Six-month comparative chart of European and US equity indices

According to Bernstein analyst Sarah McCarthy “equities are still attractive relative to bonds in Europe whereas this is no longer the case in the US.” She notes that while bond yields have risen in both the US and Europe since the end of 2019, valuations have de-rated by 14% in Europe but held steady in the US. That has pushed the equity risk premium above its long-term average in Europe, but below it in the US.
What do the charts say for European equity indices?
CAC 40
The CAC 40 has had a tremendous start to the year and has so far risen by around 18% to its all-time record high at 7,401.15 before short-term consolidating.
From an Elliott wave perspective the index seems to be in a third of a third wave advance which means that further upside should be in store which could take the CAC 40 to the minor psychological 7,500 level in the days ahead and then further up towards the psychological 8,000 mark.
CAC 40 Daily Chart

Once has to be aware, though, that a wave count can be truncated and that the CAC 40 may fall short of these potential upside targets and instead may soon be forming a top, especially since this week’s record high has been accompanied by negative divergence on the daily Relative Strength Index (RSI).
Having said that, on two previous occasions negative divergence could be spotted on the daily chart this year and each time the CAC 40 nonetheless chose to advance further still.
For the scenario of a top formation to take shape, a fall through and at least one daily chart close below the 10 February and early March lows as well as the October-to-March uptrend line at 7,169.66 to 7,074.63 would have to be seen. Unless this is the case, the odds should continue to favour further upside.
DAX 40
On Tuesday, the DAX 40 traded at level last seen in January 2022 and rose to 15,706.37 before consolidating below that high on hawkish Fed and ECB comments.
Its Elliott wave count is similar to that of the CAC 40 in that it probably hasn’t ended its third of a third wave higher yet although it also displays negative divergence on its daily RSI which hasn’t confirmed the indices’ latest rally.
Provided that the DAX 40 doesn’t fall through its early March low at 15,150.67, short-term upside pressure is likely to be maintained with the February 2022 high at 15,736.52 being eyed, a rise above which would open the way for the minor psychological 16,000 mark to be reached.
DAX 40 Daily Chart
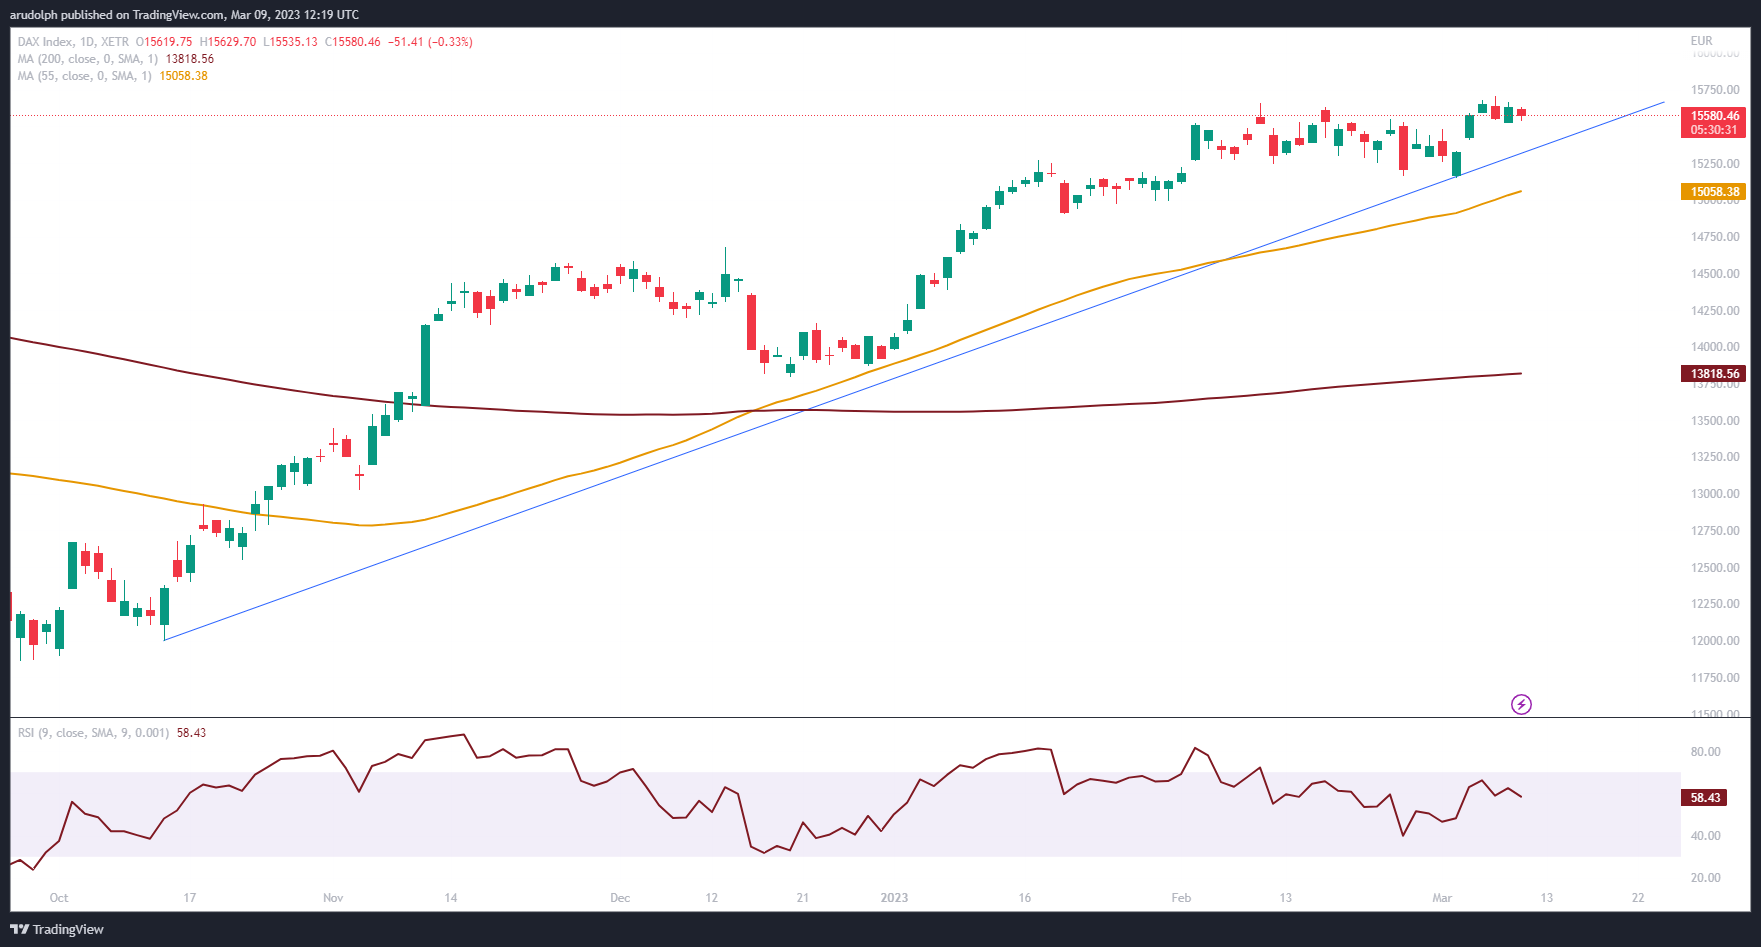
Ahead of the 15,150.67 recent low, the October-to-March uptrend line at 15,325 is expected to offer support, if revisited.
FTSE 100
Having risen to last week’s high at 7,976.3, the FTSE 100 has been dragged down by the US Federal Reserve (Fed’s) Chair Jerome Powell’s two-day testimony to Congress in which he stated that the Fed is “prepared to increase the pace of interest rate hikes” if the data required it but that no decision on the March meeting had yet been taken.
The FTSE 100’s slide through its October-to-March uptrend line has led to the index dropping towards its 7,852.8 to 7,849.5 key support area which consists of the 10 February and last week’s lows.
As long as this significant support zone holds, the medium-term uptrend remains valid, though, with an advance above last week’s high at 7,976.3 putting its all-time record high at 8,045.5 back in the frame.
FTSE 100 Daily Chart

Were 7,849.5 to give way on a daily chart closing basis, a medium-term top would likely be formed with the late January low at 7,706.8 representing the next downside target.
This information has been prepared by IG, a trading name of IG Markets Ltd and IG Markets South Africa Limited. In addition to the disclaimer below, the material on this page does not contain a record of our trading prices, or an offer of, or solicitation for, a transaction in any financial instrument. IG accepts no responsibility for any use that may be made of these comments and for any consequences that result. No representation or warranty is given as to the accuracy or completeness of this information. Consequently any person acting on it does so entirely at their own risk. Any research provided does not have regard to the specific investment objectives, financial situation and needs of any specific person who may receive it. It has not been prepared in accordance with legal requirements designed to promote the independence of investment research and as such is considered to be a marketing communication. Although we are not specifically constrained from dealing ahead of our recommendations we do not seek to take advantage of them before they are provided to our clients. See full non-independent research disclaimer and quarterly summary.

Take a position on indices
Deal on the world’s major stock indices today.
- 1-point spread on the FTSE 100 and Germany 40
- The only provider to offer 24-hour pricing
Live prices on most popular markets
- Forex
- Shares
- Indices
Prices above are subject to our website terms and agreements. Prices are indicative only