GBP/USD holds while USD/JPY and USD/CNH rise on stronger US dollar
Outlook on GBP/USD, USD/JPY and USD/CNH amid ongoing Israel/Gaza crisis.


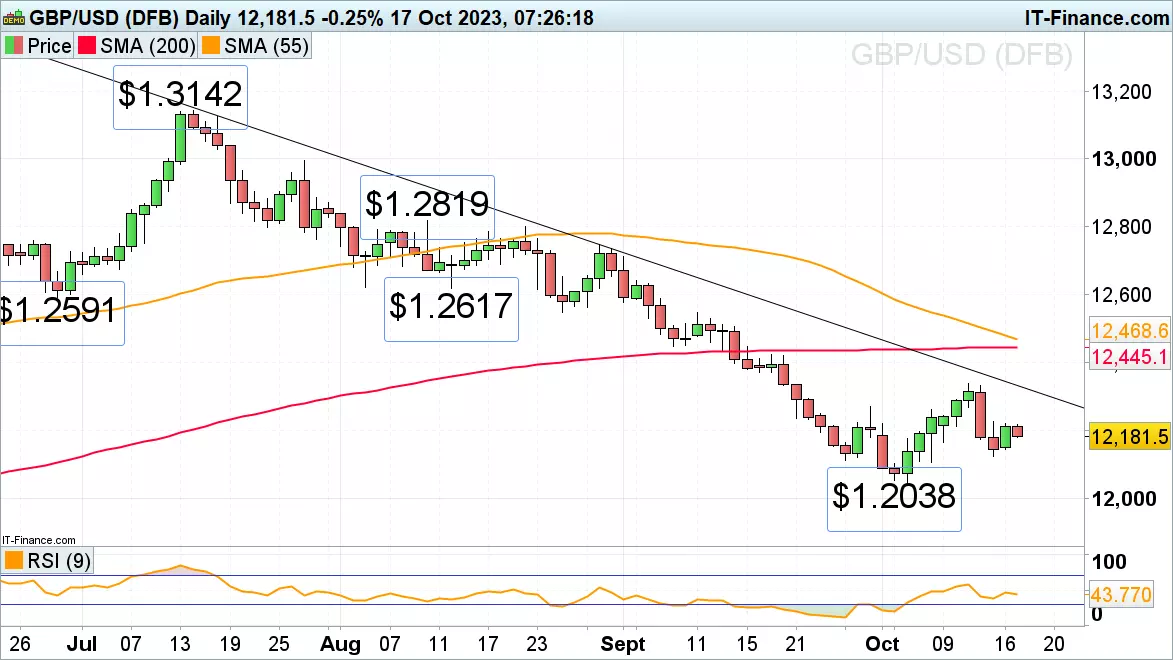
GBP/USD still stabilizes after last week’s sharp sell-off
GBP/USD's rise from its early-October seven-month low at $1.2038 to last week’s $1.2337 high was followed by a swift decline to $1.2123 as the Israel/Gaza crisis led to flight-to-safety flows into the US dollar.
So far this week the cross managed to stabilize above the $1.2123 low as UK wage growth came in lower-than-expected, at the lowest level in three months.
A fall through Friday’s low at $1.2123 and the next lower $1.2106 previous Friday low remains a possibility, though. If so, it could provoke a slide to the early-October low at $1.2038 and the psychological $1.20 mark. While Friday’s low at $1.2123 holds, however, Friday’s high at $1.2225 may be revisited. Further up lies the late-September high at $1.2271.
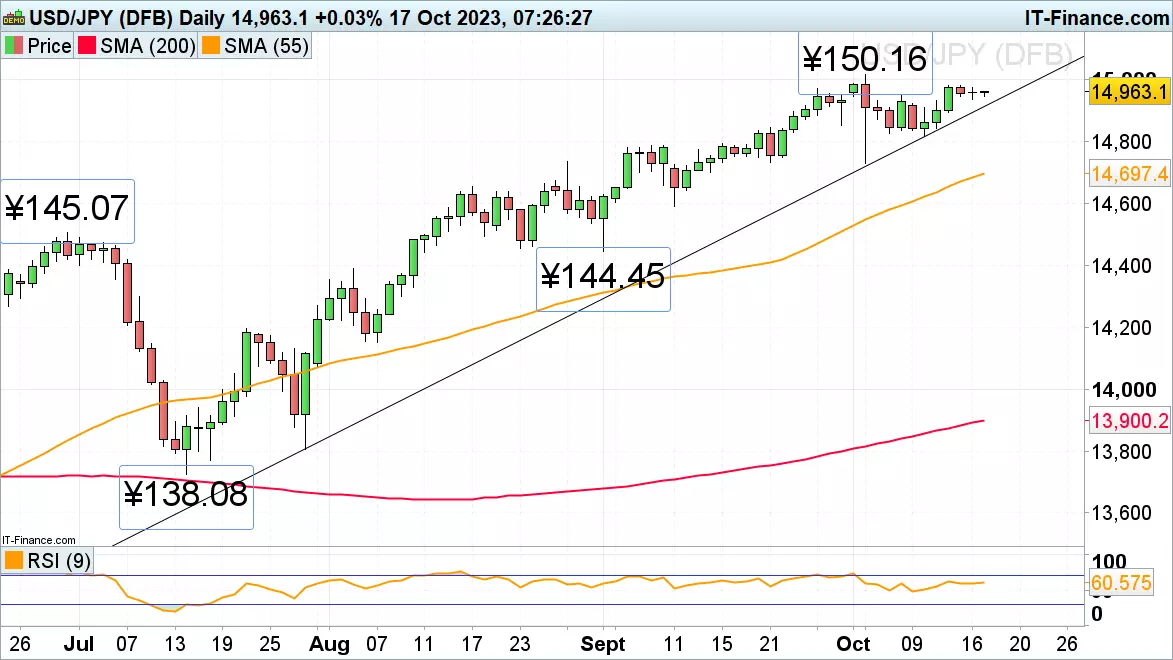
USD/JPY gravitates towards the ¥150.00 mark
Despite the increased risk of Bank of Japan (BoJ) currency intervention as USD/JPY approaches the psychological ¥150.00 mark, the cross continues to drift higher towards it. Above it lies the early-October high at ¥150.16.
Support can be spotted along the July-to-October tentative uptrend line at ¥149.18.
While the next lower 10 October low at ¥148.17 underpins, the uptrend remains intact.
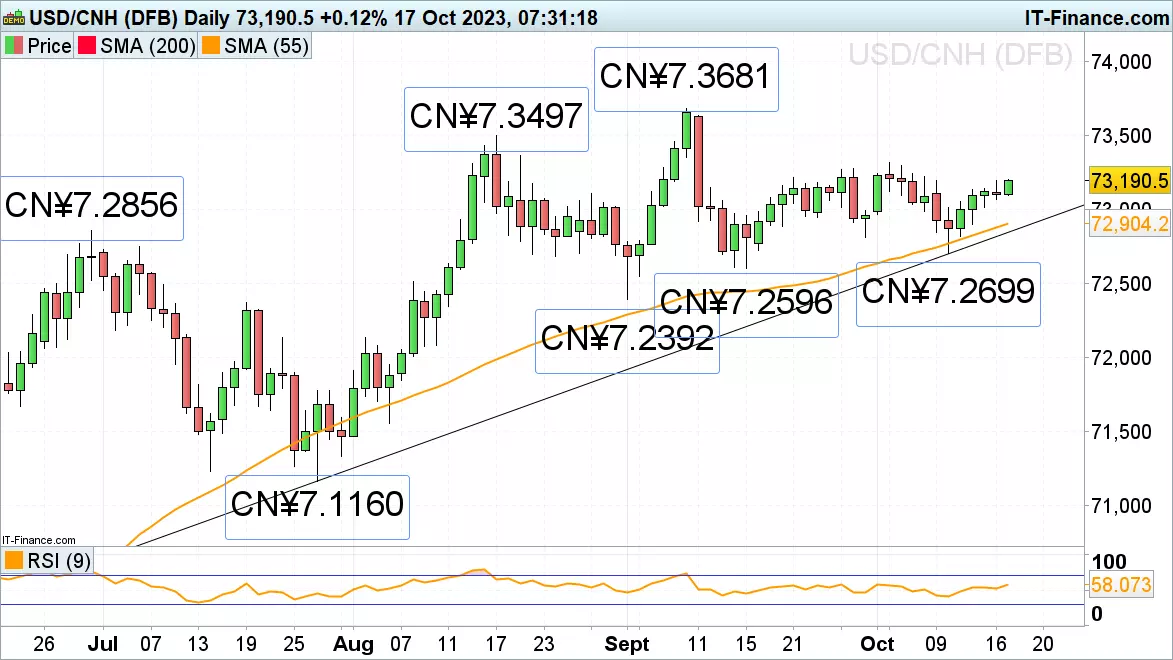
USD/CNH continues to creep higher
Recent concerns regarding deflation in China and flight-to-quality flows into the US dollar on heightened Middle East tensions helped USD/CNH rise towards its CN¥7.3316 early-October high.
A rise above the CN¥7.3316 level would mean that the cross is leaving its mid-September-to-October sideways trading range with the August and September highs at CN¥7.3497 to CN¥7.3681 then being in focus.
Minor support sits at last Tuesday’s CN¥7.3013 high and more significant support further down between the 55-day simple moving average (SMA), the July-to-October uptrend line and the late-September low at CN¥7.2904 to CN¥7.2811.
This information has been prepared by IG, a trading name of IG Markets Ltd and IG Markets South Africa Limited. In addition to the disclaimer below, the material on this page does not contain a record of our trading prices, or an offer of, or solicitation for, a transaction in any financial instrument. IG accepts no responsibility for any use that may be made of these comments and for any consequences that result. No representation or warranty is given as to the accuracy or completeness of this information. Consequently any person acting on it does so entirely at their own risk. Any research provided does not have regard to the specific investment objectives, financial situation and needs of any specific person who may receive it. It has not been prepared in accordance with legal requirements designed to promote the independence of investment research and as such is considered to be a marketing communication. Although we are not specifically constrained from dealing ahead of our recommendations we do not seek to take advantage of them before they are provided to our clients. See full non-independent research disclaimer and quarterly summary.

Start trading forex today
Trade the largest and most volatile financial market in the world.
- Spreads start at just 0.6 points on EUR/USD
- Analyse market movements with our essential selection of charts
- Speculate from a range of platforms, including on mobile
Live prices on most popular markets
- Forex
- Shares
- Indices
Prices above are subject to our website terms and agreements. Prices are indicative only