BP share price on watch ahead of Q2 earnings
BP’s share price has retraced more than 14% from its one-year high since June. Can its upcoming results boost its share price?


When does BP report earnings?
British Petroleum (BP) is set to release its Q2 financial results on 3 August, along with the announcement for its dividend payout.
BP earnings – What to expect
For its previous quarter, BP has delivered a stronger-than-expected performance, enabling it to meet its US$35bn debt reduction target a year earlier than expected. This opens up the gateway for US$500 million in share buybacks this year, pointing to a vote of confidence from the management for the company’s outlook ahead.
As BP halved its dividend last year to deal with the Covid-19 impact on oil demand, investors may be looking out for any positive surprise in terms of upward revision in payout. This comes off the back of continued improvement in financial performance, along with higher oil prices for the second quarter. Expectations are for revenue to come in at US$38.3 million for the upcoming quarter, a 20.8% increase year-on-year and a 10.8% increase from the previous quarter.
Having previously laid out its intention to return 60% of surplus cash flow to shareholders, any improvement in cash flow for subsequent quarters may be closely watched. The company has generated about US$1.7 billion in surplus cash in the first quarter, with overall free cash flow largely improving after an initial plunge in Q1 2020. While near-term cash flow may potentially be capped by payment costs relating to the Gulf of Mexico oil spills, the longer-term trajectory seems to lean towards further improvement as global economic recovery continues and the impact from one-off costs wear off.

Recent results from one of its peers, Royal Dutch Shell, came with an earnings beat and the company revealed an increase in dividend, along with US$2 billion of share buybacks this year. Similarly, TotalEnergies SE also saw a profit surge and indicated that it will start repurchasing shares. Overall, this may provide an early indication for the upcoming BP’s results, which is highly likely to mirror its peers’ performance, riding along with the economic recovery tailwind for the overall sector.
Valuation
BP’s current forward price-to-earnings ratio stands at 7.91, seemingly trading at a cheaper valuation compared to other global oil giants at first glance. That said, this may come as its revenue growth over the past three years has been largely trailing behind its global peers.
Based on Refinitiv estimates at the time of writing, the stock has 14 ‘buy’ recommendations, nine ‘holds’ and four ‘sells’. The stated target price of £358.18 suggests a potential 24.2% upside from current price.

BP shares – technical analysis
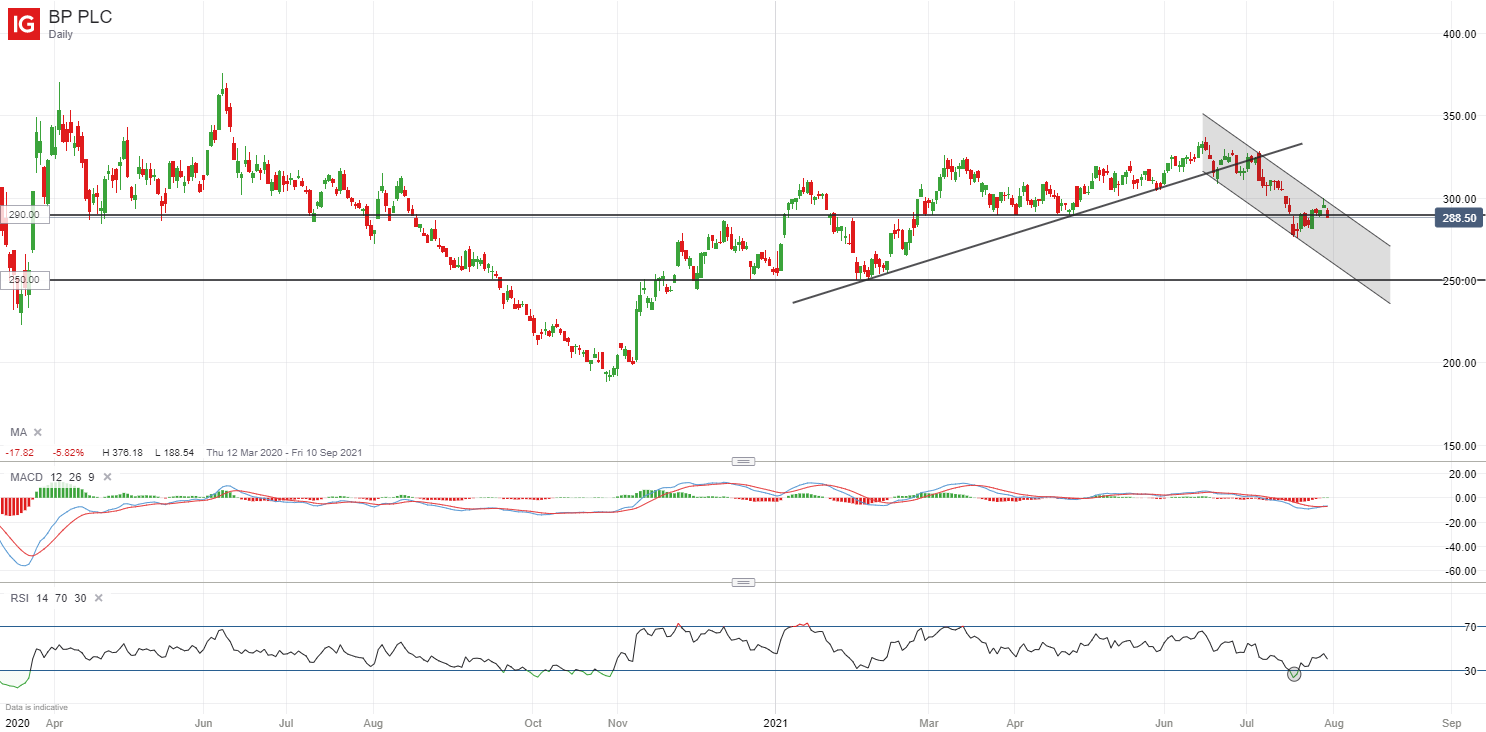
From its technicals, BP share price seems to be trading in a downtrend near-term, as marked by a series of lower highs and lower lows since the start of the month. This comes after share prices broke below an upward trendline previously, which has been serving as a line of support on previous three occasions, bringing a shift in sentiments to the downside.
A slight rebound, based on the oversold region in the RSI, find prices re-testing a key horizontal support level at £290. Should the level fail to hold, prices may potentially move lower to test the next support level at £250, which has held prices up on previous two occasions. For near-term resistance, a downward trendline connecting recent lower price highs will be one to overcome.
This information has been prepared by IG, a trading name of IG Markets Ltd and IG Markets South Africa Limited. In addition to the disclaimer below, the material on this page does not contain a record of our trading prices, or an offer of, or solicitation for, a transaction in any financial instrument. IG accepts no responsibility for any use that may be made of these comments and for any consequences that result. No representation or warranty is given as to the accuracy or completeness of this information. Consequently any person acting on it does so entirely at their own risk. Any research provided does not have regard to the specific investment objectives, financial situation and needs of any specific person who may receive it. It has not been prepared in accordance with legal requirements designed to promote the independence of investment research and as such is considered to be a marketing communication. Although we are not specifically constrained from dealing ahead of our recommendations we do not seek to take advantage of them before they are provided to our clients. See full non-independent research disclaimer and quarterly summary.

Seize a share opportunity today
Go long or short on thousands of international stocks.
- Increase your market exposure with leverage
- Get spreads from just 0.1% on major global shares
- Trade CFDs straight into order books with direct market access
Live prices on most popular markets
- Forex
- Shares
- Indices
Prices above are subject to our website terms and agreements. Prices are indicative only