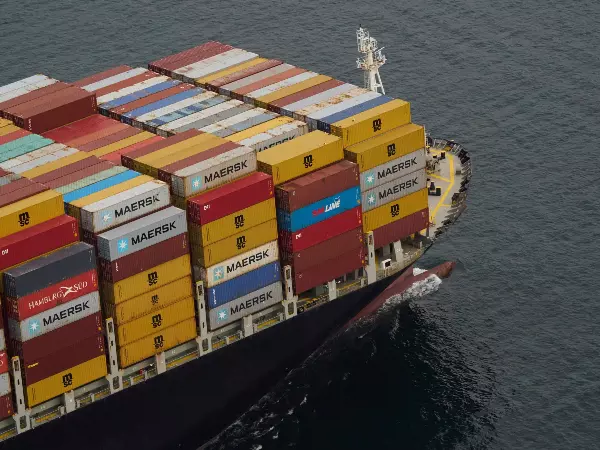
Baltic dry, Capesize and mining stocks resume descent despite China stimulus
Baltic Dry and Capesize highlight slowing commodity demand

Baltic Dry and Capesize indices under pressure
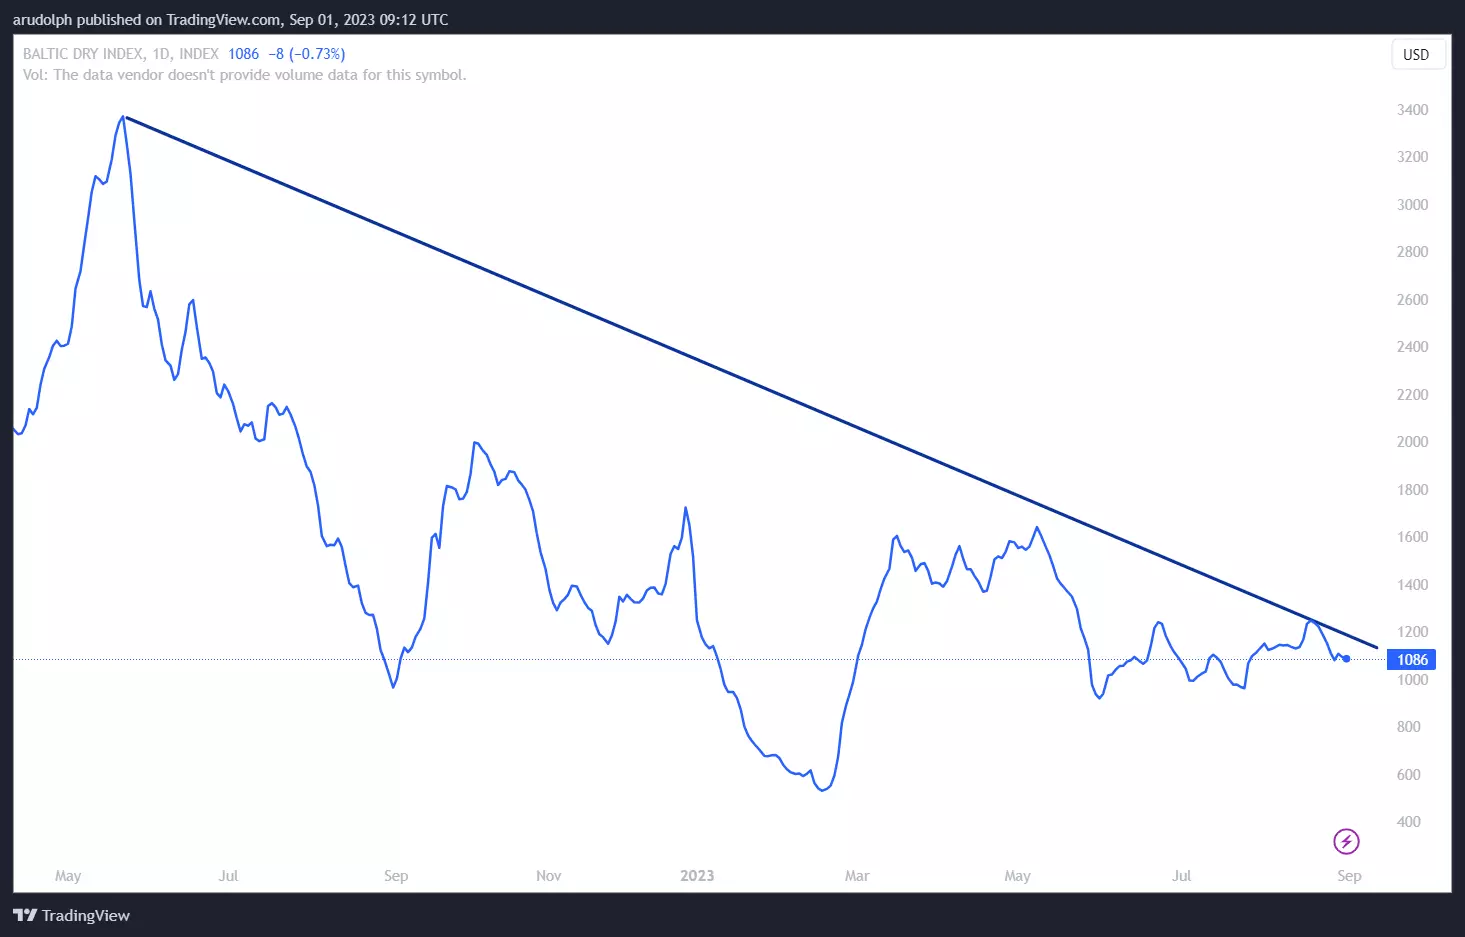
The Baltic Dry index has reached a fresh one-month low today as it resumes its descent which began in mid-August.
Meanwhile, the Baltic Capesize index, which tracks iron ore and coal cargos of 150,000 tonnes, is weighing on its June lows. It looks likely to soon be slipped through in which case levels last traded in February would be eyed.
This drop in demand for ships highlights a worsening environment for commodities, coinciding with China’s economic woes.
On Thursday China unveiled steps to increase personal income tax deductions for child care, parental care and children’s education spending in order to boost household consumption and its economy.
On Friday the People's Bank of China (PBoC) also said that it would lower the foreign exchange reserve requirement ratio (RRR) by 200 basis points to 4% from 6% mid-September. It was the first such reduction this year, as the central bank seeks to prop up the falling yuan and help China’s faltering economic recovery.
At the same time China’s government is also proposing to lift home-purchasing restrictions in non-core districts of major cities such as Beijing, Shanghai and Shenzhen in order to end the country’s two-year housing slump which is key to reviving growth because the sector and related industries make up about a fifth of the economy.
Nonetheless, unless these stimulus measures increase consumption and spending in China, commodity stocks look primed for another bout of weakness.
Baltic Dry Index Daily Line Chart
FTSE 350 miners try to bounce off a 7 ½ year low
While there are a number of ways to play commodity stocks, the FTSE 350 mining sector does do a good job of covering a wide range of stocks related to the sector.
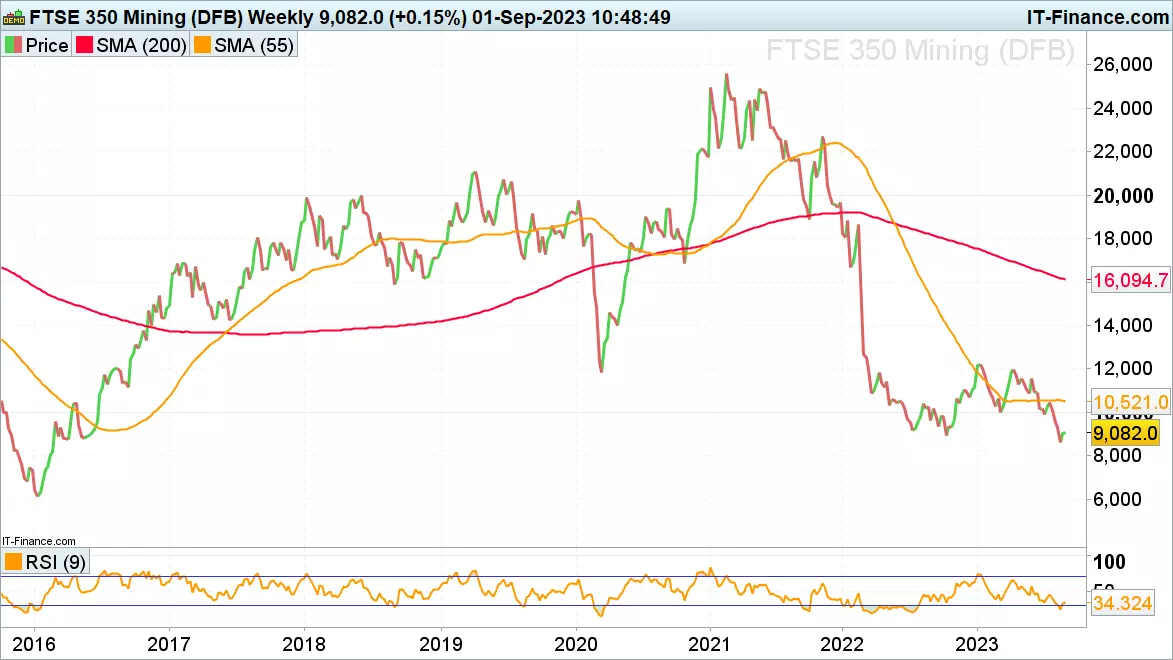
The chart below shows how the UK mining sector dropped to a 7 ½ year low in August before gingerly recovering alongside global stock indices on hopes that the Federal Reserve (Fed) may pause its tightening monetary policy cycle on the back of slowing US growth and cooling US labour market data.
FTSE 350 Mining Sector Weekly Line Chart
On the daily timeframe, despite last week’s up to around 7% bounce, the FTSE 350 miners index clearly remains within a long-term downtrend. Only a rise above the July peak at 10,671 would negate the medium-term downtrend.
FTSE 350 Mining Sector Daily Candlestick Chart
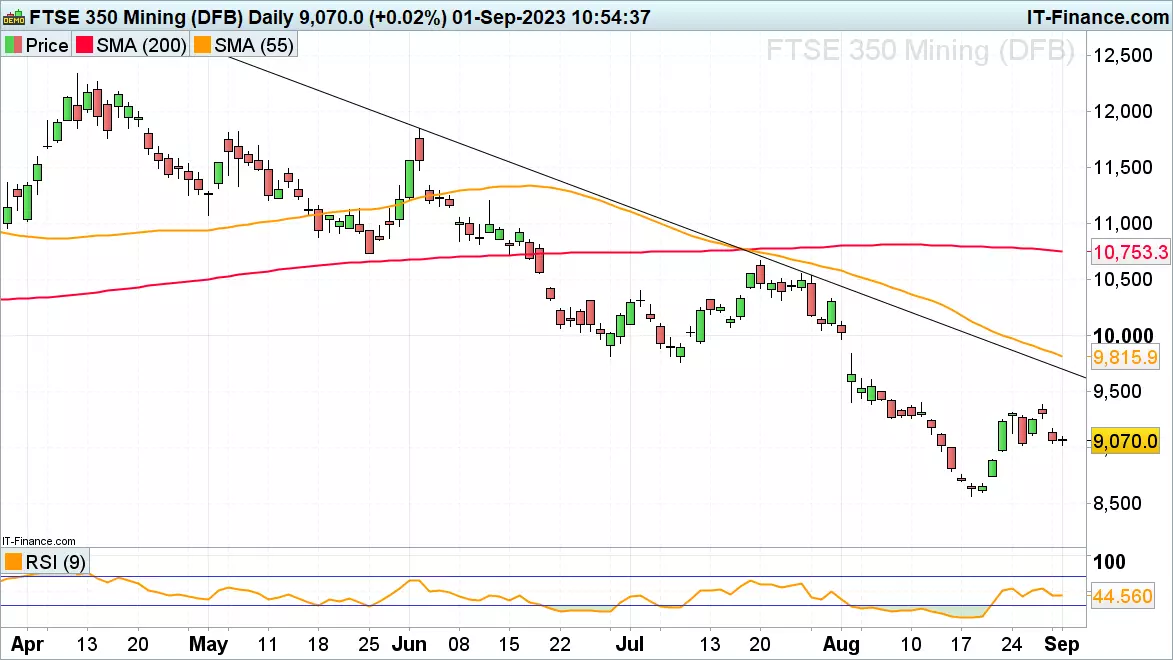
Unless this were to happen, the odds continue to favour further declines with a fall through the August low at 8,568 putting the April and May 2016 lows at 8,478 to 8,337 on the map.
This information has been prepared by IG, a trading name of IG Markets Ltd and IG Markets South Africa Limited. In addition to the disclaimer below, the material on this page does not contain a record of our trading prices, or an offer of, or solicitation for, a transaction in any financial instrument. IG accepts no responsibility for any use that may be made of these comments and for any consequences that result. No representation or warranty is given as to the accuracy or completeness of this information. Consequently any person acting on it does so entirely at their own risk. Any research provided does not have regard to the specific investment objectives, financial situation and needs of any specific person who may receive it. It has not been prepared in accordance with legal requirements designed to promote the independence of investment research and as such is considered to be a marketing communication. Although we are not specifically constrained from dealing ahead of our recommendations we do not seek to take advantage of them before they are provided to our clients. See full non-independent research disclaimer and quarterly summary.

Take a position on indices
Deal on the world’s major stock indices today.
- 1-point spread on the FTSE 100 and Germany 40
- The only provider to offer 24-hour pricing
Live prices on most popular markets
- Forex
- Shares
- Indices
Prices above are subject to our website terms and agreements. Prices are indicative only