Are the so-called ‘Magnificent Seven’ losing their lustre?
Share price differentials of over 100% between the top and bottom Magnificent Seven stocks means that we may soon be talking of the Magnificent Five or less.


2024 Magnificent Seven performance doesn’t resemble that of 2023
Having gained 49% in 2023 the so-called Magnificent Seven stocks, i.e. Alphabet, Amazon, Apple, Meta, Nvidia and Tesla, are greatly diverging with regards to their year-to-date share performance.
While the Nvidia share price continues to surge higher, up around 85% year-to-date, followed by Meta Platforms’ at around 46%, Amazon’s at 22% and Alphabet’s by 12%, the Apple share price dropped by around 9% and that of Tesla by nearly 33% since the beginning of the year.
Magnificent Seven year-to-date share price comparison chart
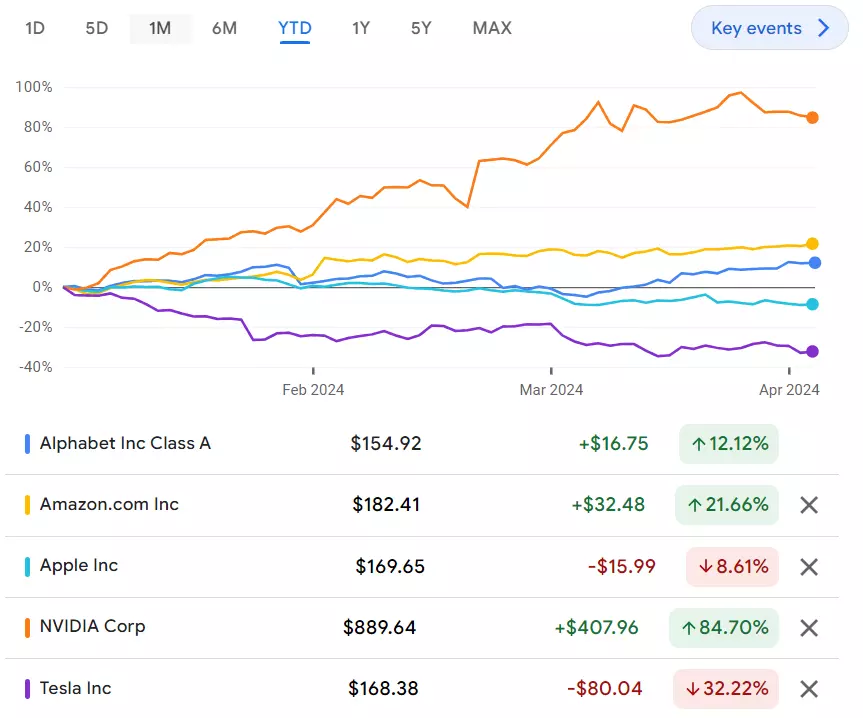
Although the Apple and Tesla share prices were already underperforming the other Magnificent Seven stocks in 2023, their shares ended the year in positive territory. This may not be the case in 2024.
Technical analysis on the Magnificent Seven stocks
Technical analysis on the Apple share price
The Apple share price topped out in December of last year, having already done so in July, and has been coming off its $196.38 late-January high over the past few months with it slipping towards its October 2023 low at $165.67.
The October low is technically key as a fall through it would form a long-term double top formation which could lead to the 200-week simple moving average (SMA) at $151.22 being reached in the course of this year.
Apple Weekly Candlestick Chart
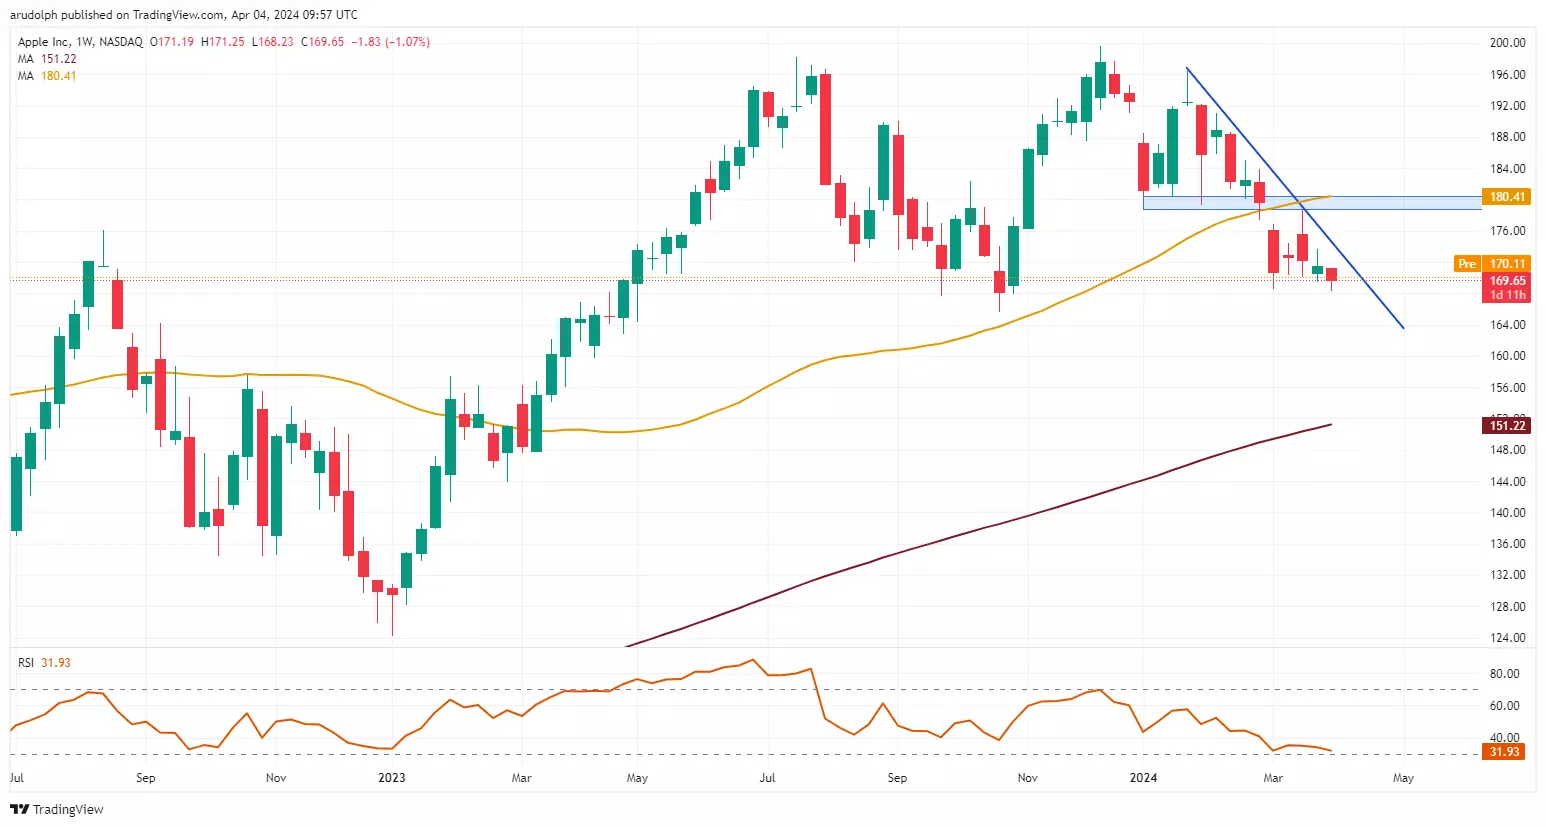
The risk of such a decline unfolding will remain in play while the January lows and 55-week SMA at $179.25 to $180.41 thwart any upside bounce. In mid-March this key resistance zone already capped the upside and failure there provoked the current descent with the March low at $168.49 being revisited.
Technical analysis on the Tesla share price
Some investors seem to forget that the Tesla share price has been in a long-term downtrend from its $414.50 November 2021 peak.
The three-legged advance from the January 2023 low to the July 2023 high was just an Elliott wave zig zag correction within the long-term downtrend with the March low at $160.51 remaining in sight.
Tesla Weekly Candlestick Chart
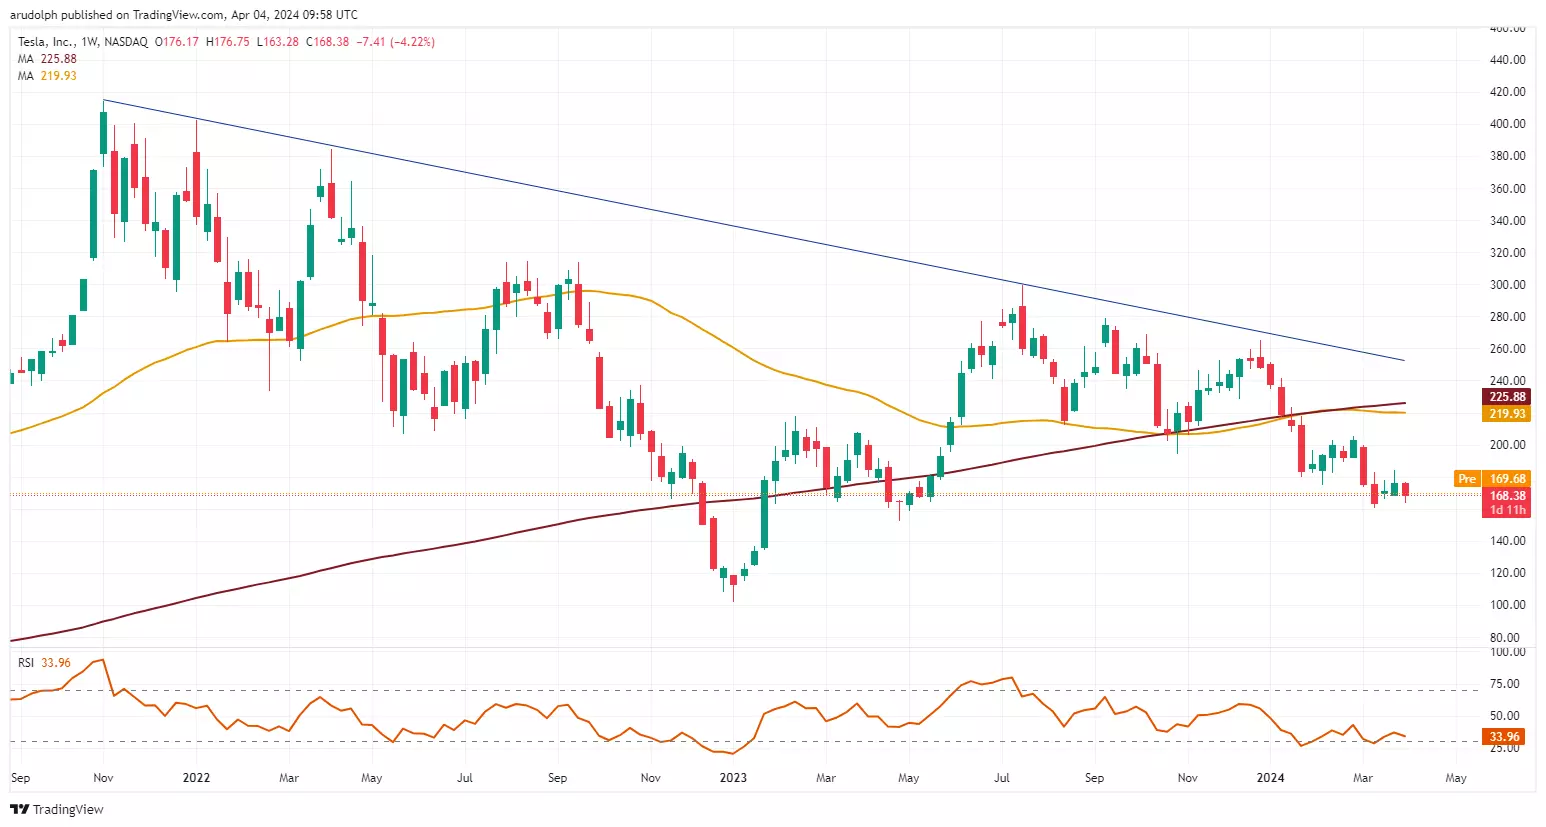
A fall through the $160.51 early-March low would push the April 2023 low at $152.37 and the psychological $150 region to the fore.
Technical analysis on Alphabet, Amazon, Meta and Nvidia
Alphabet trades in new record highs and is gunning for the $160 region and above with the November 2021 and January 2022 peaks at $151.55 to $150.97, together with the psychological $150 mark offering immediate support.
Alphabet Weekly Candlestick Chart
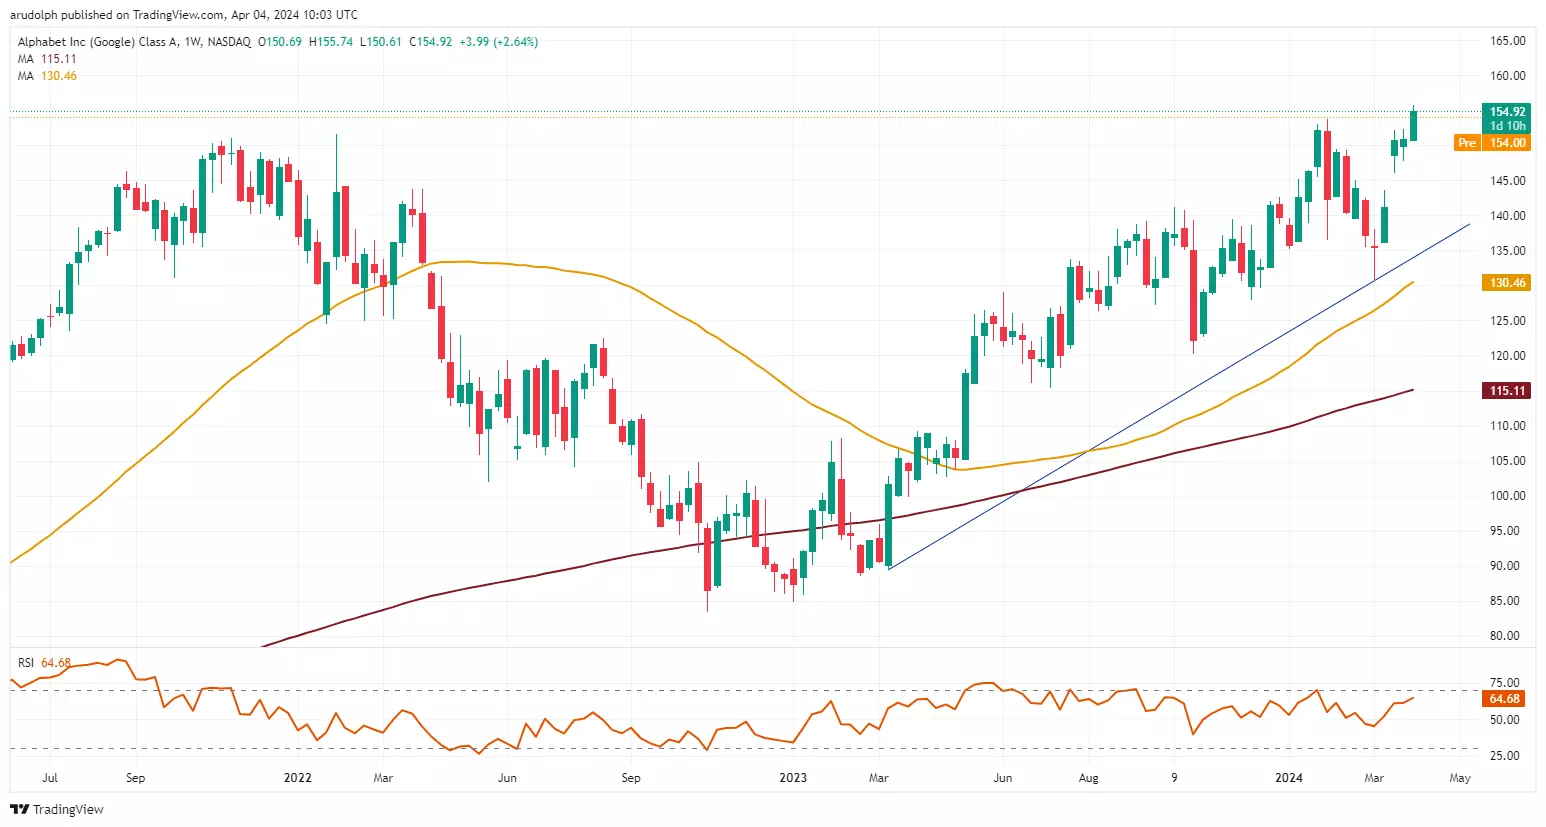
While the next lower August 2021 and March 2022 highs at $146.25 to $143.79 underpin, the medium-term uptrend looks intact. From a technical analysis point of view the bullish outlook would only be questioned if a currently unlikely bearish reversal were to take the Alphabet share price below its $130.67 March low.
The Amazon share price looks similar in that it is getting ever closer to its July and November 2021 peaks at $188.11 to $188.65 which may once again thwart the advance, though.
Amazon Weekly Candlestick Chart
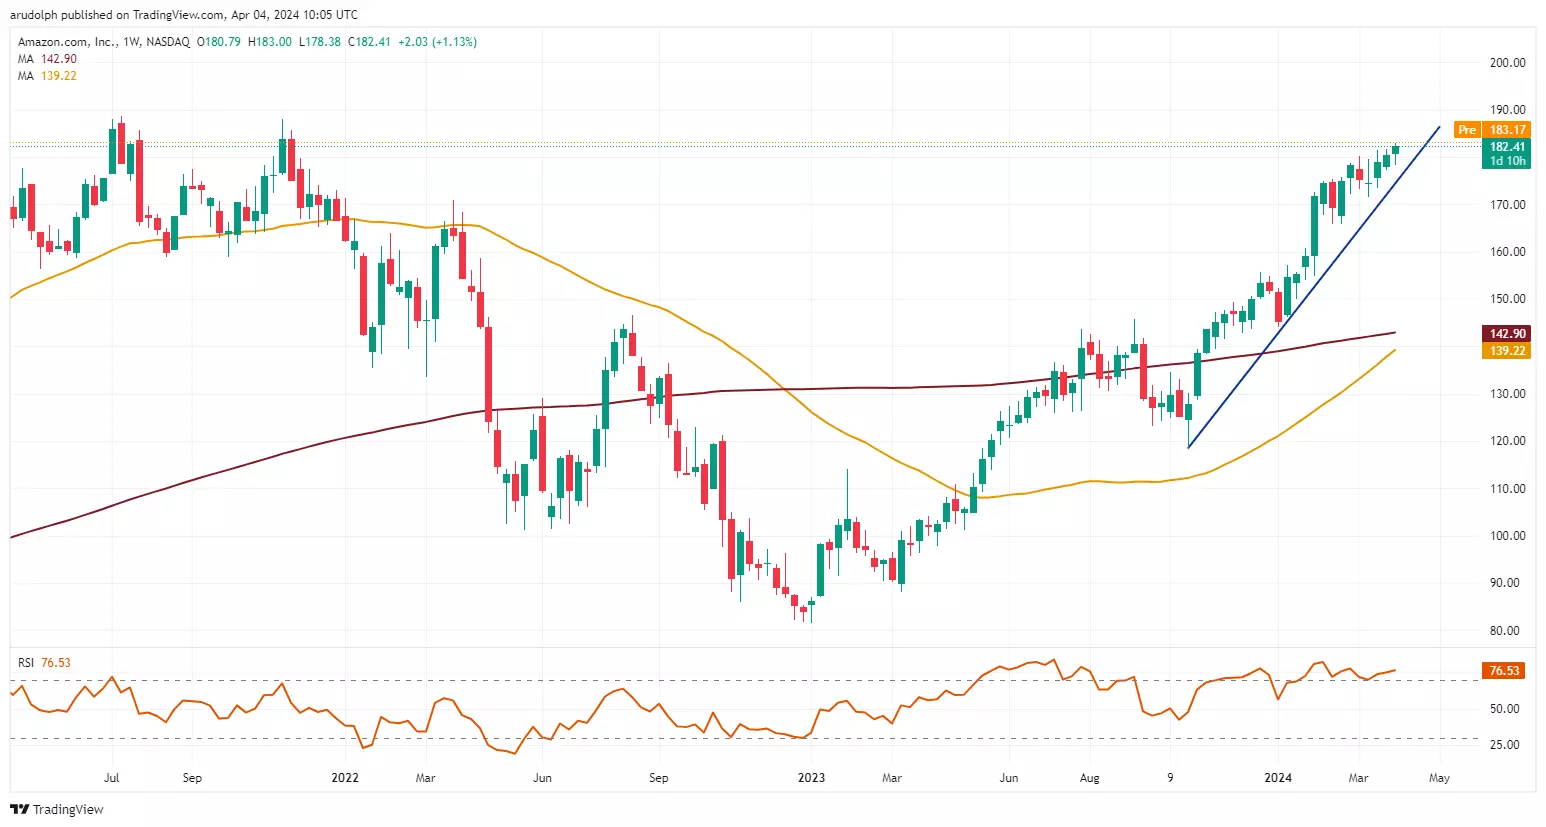
For the medium-term Amazon uptrend to be questioned, a fall through the late-February low at $165.74 would have to occur.
Like Alphabet, Meta is trading close to its March all-time high at $523.57, a rise above which would engage the $550 region ahead of the $600 mark.
Meta Weekly Candlestick Chart
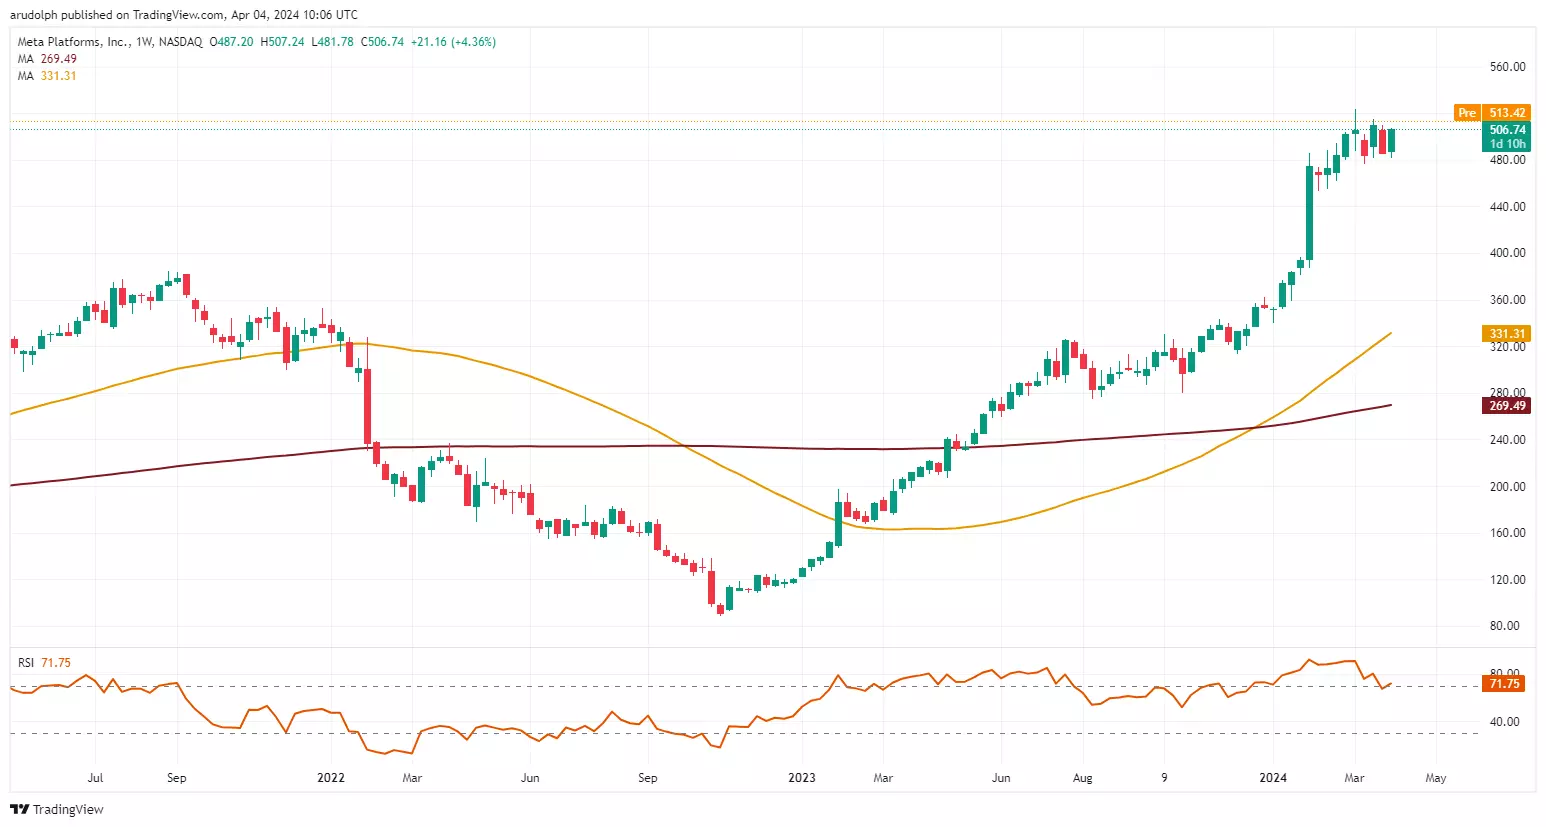
A slow down in the rate of ascent may be seen over the coming weeks, though, as already has been the case over the past few weeks.
While no bearish reversal takes the Meta share price to below its $387.10 late January low, from where the latest strong up thrust has been made, the medium-term uptrend will remain intact.
Even the parabolic rise in the Nvidia share price is showing signs of at least short-term stalling below its $974 early March high, made close to the psychological $1,000 mark.
Nvidia Weekly Candlestick Chart
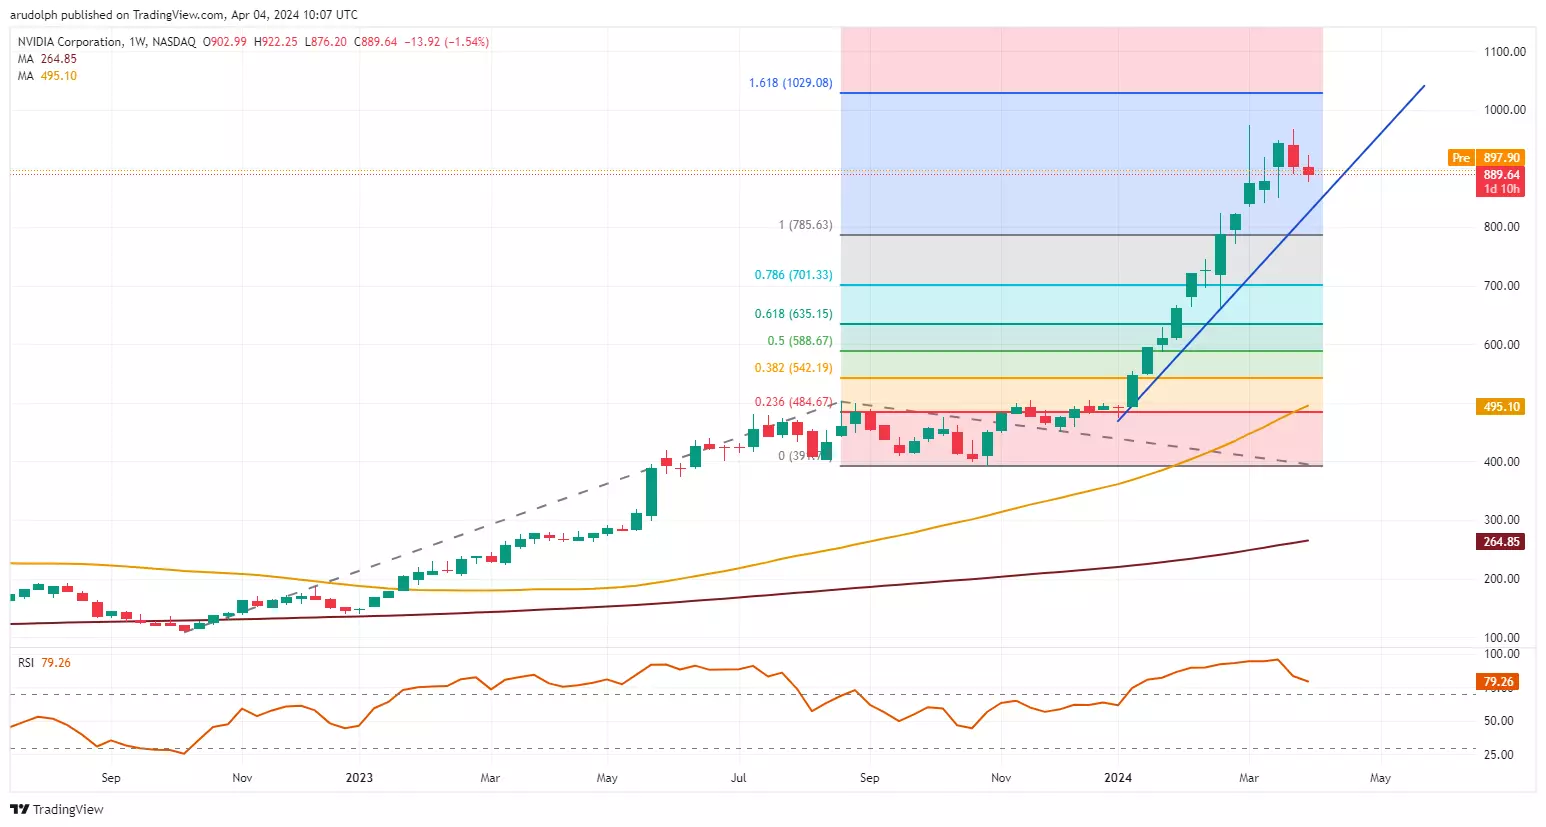
A rise above $974 would likely lead to the 161.8% Fibonacci extension of the October 2022 to August 2023 advance, projected higher from the late-October low, at $1,029 being reached.
Support can be seen along the steep 2024 accelerated uptrend line at $827.24 and, much further down, at the late-February low at $662.48. While it holds, the medium-term uptrend remains firmly entrenched.
This information has been prepared by IG, a trading name of IG Markets Ltd and IG Markets South Africa Limited. In addition to the disclaimer below, the material on this page does not contain a record of our trading prices, or an offer of, or solicitation for, a transaction in any financial instrument. IG accepts no responsibility for any use that may be made of these comments and for any consequences that result. No representation or warranty is given as to the accuracy or completeness of this information. Consequently any person acting on it does so entirely at their own risk. Any research provided does not have regard to the specific investment objectives, financial situation and needs of any specific person who may receive it. It has not been prepared in accordance with legal requirements designed to promote the independence of investment research and as such is considered to be a marketing communication. Although we are not specifically constrained from dealing ahead of our recommendations we do not seek to take advantage of them before they are provided to our clients. See full non-independent research disclaimer and quarterly summary.

See an opportunity to trade?
Go long or short on more than 17,000 markets with IG.
Trade CFDs on our award-winning platform, with low spreads on indices, shares, commodities and more.
Live prices on most popular markets
- Forex
- Shares
- Indices
Prices above are subject to our website terms and agreements. Prices are indicative only