




Macro Update
Oil extends sharp gains: Brent rose 1.1% to $97.37 a barrel and US crude advanced over 1% to $92.57, extending last week’s near-8% surge after US forces struck three Iranian tankers and Iran’s Revolutionary Guards fired missiles at two US Navy ships in the Gulf.
Hormuz disruption intensifies: Iran is set to announce a restricted zone outside the Strait of Hormuz in the coming days, while tanker traffic through the waterway has fallen to its lowest level since May, raising fears of a prolonged supply shock.
Fed hike bets firm ahead of CPI: Markets now see a 58% chance of a September rate hike following last week’s strong payrolls, with Friday’s US inflation data likely to determine the next move, while the ECB is widely expected to raise rates to 2.75% on Thursday.
Dollar struggles despite higher rate expectations: The greenback gained little from the jobs data and traded at 99.14 against a basket of currencies, as concerns over rising US debt weighed on sentiment, while the yen strengthened to ¥155.88 amid growing expectations of a September BOJ hike.
Gold slips as yields rise: Gold fell 0.3% to $4,411 an ounce as firmer rate-hike expectations pushed Treasury yields higher, with the 10-year yield near its highest level since late 2023 at 4.78%, ahead of this week’s US inflation data.
FTSE 100 continues to range trade
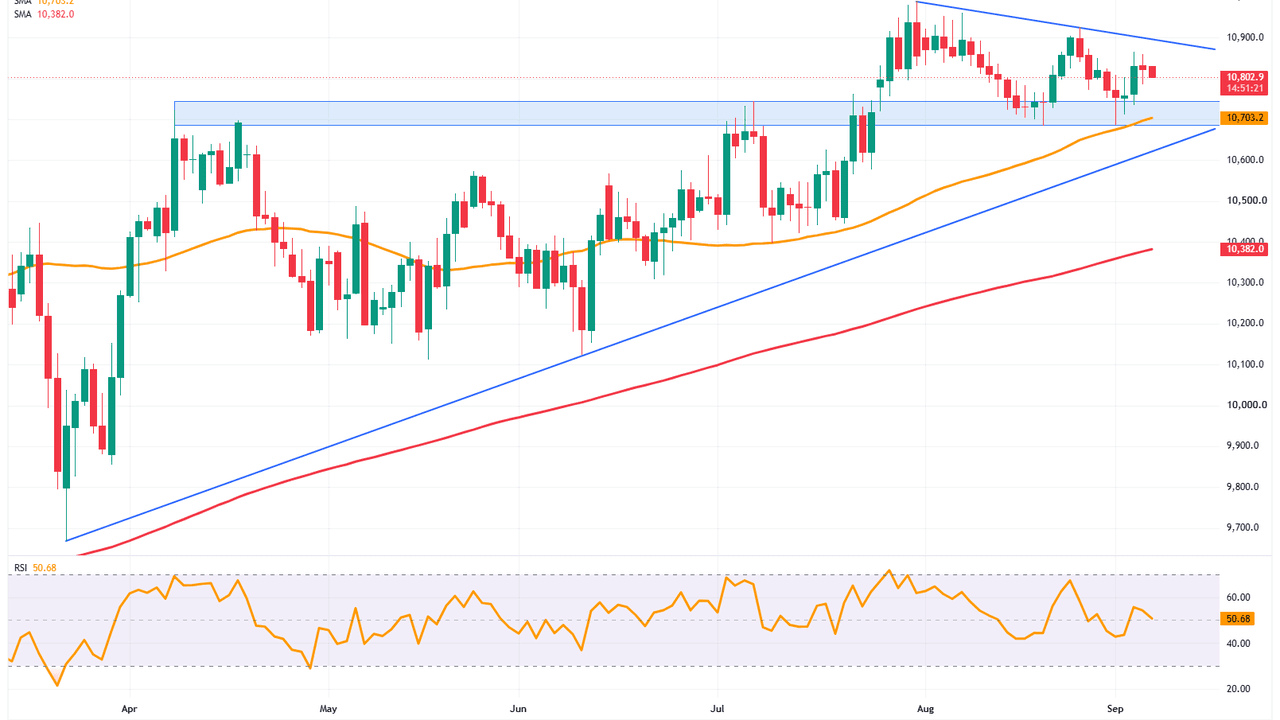
The FTSE 100's bounce off its early September low at 10,686 stalled at Thursday's 10,866 high, below which it is expected to remain today. If not, the July-to-September resistance line at 10,894 may be reached, ahead of the late August 10,925 high.
Potential minor support lies at the 27 August 10,772 low, followed by the early July high at 10,745 and the April peak at 10,724.
Short-term outlook: neutral with slight bearish slant while below the 3 September high at 10,866
Medium-term outlook: bullish while above the 20 August low at 10,684
FTSE 100 daily candlestick chart
GBP/USD recovers from support
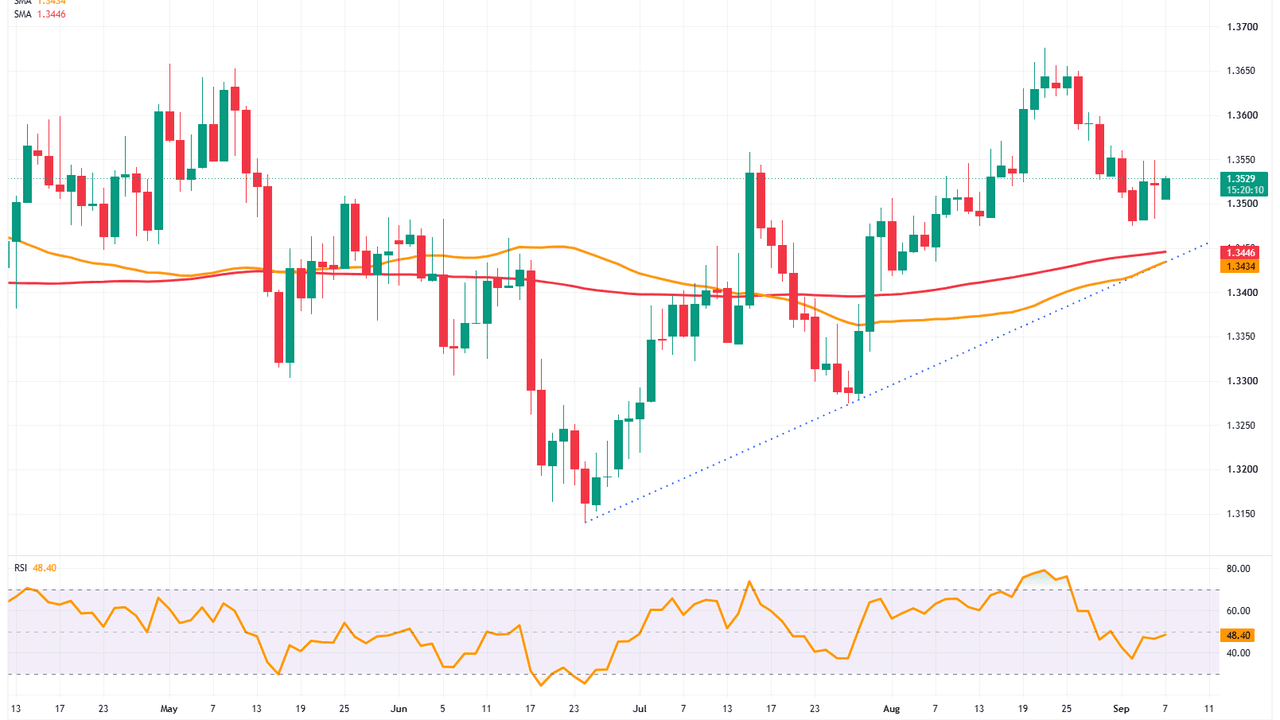
GBP/USD is still in the process of recovering from last week's $1.3475 low. A rise above its recent high at $1.3549 and the mid-July peak at $1.3558 may lead to the April-to-August highs at $1.3599-to-$1.3676 to be re-engaged.
Failure at last week's $1.3475 low would likely put the 200-day simple moving average (SMA) at $1.3445, the 55-day SMA and June-to-September support line at $1.3434 on the cards.
Short-term outlook: bullish while above the 2 September low at $1.3475
Medium-term outlook: bullish while trading above $1.3434
GBP/USD daily candlestick chart
Gold back under pressure
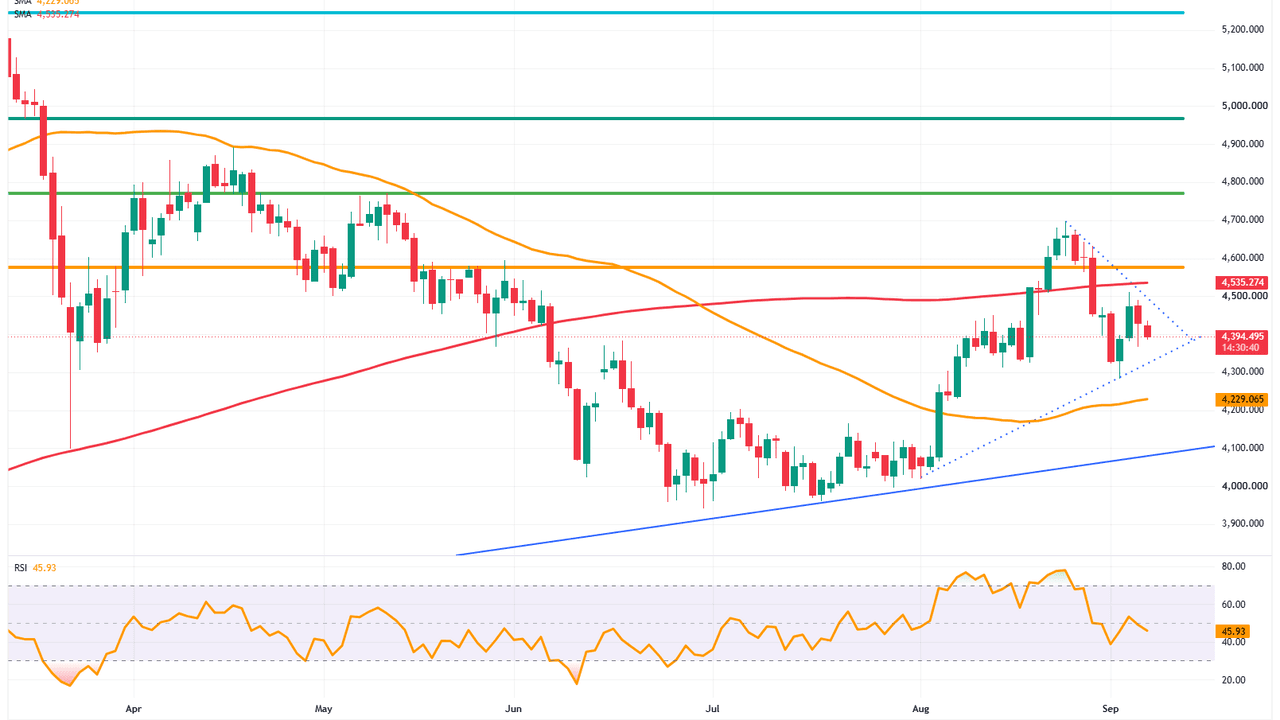
Spot gold's swift September decline last week found support at $4,397.75 before recovering to $4,510.93, to marginally below the 200-day simple moving average (SMA) at $4,535.28, only to then slip again.
Downside pressure is likely to be maintained while no bullish reversal takes the precious metal above its $4,510.93 high with the mid-June high at $4,382.61 representing the first downside target. Further down lie the 14-to-19 August lows at $4,324.68-to-$4,311.04 and last week's trough at $4,282.63.
Short-term outlook: bearish while below the 3 September high at $4,510.93
Medium-term outlook: neutral while above the 2 September low at $4,282.63 on a daily chart closing basis
Gold daily candlestick chart