US jobs report preview: ADP slump raises questions for Friday’s payrolls figure
Friday’s US jobs report expectations come into question after a disappointing ADP payrolls release.

The June US jobs report is due to be released at 1.30pm, on Friday 6 August (UK time). Coming at a time when central banks have been shifting towards a more hawkish stance, this fresh bout of unemployment data provides a key batch of data for the Federal Reserve (Fed) to mull over.
Traders will certainly view Friday’s jobs report within the context of the potential implications on the Fed’s asset purchase tapering prospects. Last month saw a an impressive 850,000 payrolls figure, coming in well above market expectations. That helps to build confidence over a potential impending recovery in the US, with that figure representing the second consecutive improvement. We are expecting to see that pathway continue once again for the month of July, with predictions of a 870,000 payrolls figure.
The chart below highlights how the June jobs improvements were helped along by strong growth in government employment, which is likely to grow further if US President Joe Biden manages to push his latest spending plan through congress.

On the unemployment front, we are expecting to see further improvements. Last month did see the rate tick up to 5.9%, but forecasts point towards the wider downtrend coming back into play with a reading around 5.7%.
One concern for the Fed to consider will be the elevated participation rate, with much needed improvements in that reading providing upward pressure on the unemployment rate.
As such, it will also make sense to keep an eye out on the U-6 measure of unemployment, which includes individuals often overlooked by the headline U-3 figure.

Companies have been finding it difficult to hire over the course of this recovery, with businesses struggling to meet the surge in demand in recent months.
That hiring squeeze could result in a subsequent rise in wages, driving cost-push inflation. With that in mind, keep an eye out for the average earnings figure, with markets expecting to see the yearly figure of 3.6% remain in place once again.
Any significant rise in that figure could raise questions over a potential uptick in inflation over months to come.
What do other employment readings tell us?
Expectations of an improved non-farm payrolls figure highlights hopes that this recovery will continue to gather pace despite the spread of the Delta variant. It is therefore useful to look elsewhere to see if secondary employment surveys point to such a move.
Automatic data processing (ADP) payrolls: the latest July ADP payrolls figure made for uncomfortable reading, with the disappointing reading of 330k representing the lowest level since February. With the prior figure of 692k also revised lower to 680k, many will be worried that we could similarly see Friday’s headline payrolls figure disappoint.
While many will point our that the correlation between the ADP and headline payrolls figures can be questionable at times, the chart below highlights that this weak ADP figure could point towards a somewhat underwhelming headline release.

Jobless claims: the initial jobless claims figure does appear to signal something similar to that trend forecast in the payrolls release. We are seeing slight improvements, yet things have largely moved sideways over the course of July.

Institute for supply management (ISM) manufacturing and non-manufacturing purchasing managers index (PMI): we saw good news from the July ISM manufacturing, where the employment element pushed back into growth territory. The jump from 49.9 to 52.9 signalled a shift from contraction territory into expansion for the sector. Meanwhile, non-manufacturing provided another move into expansion, with the employment gauge rising from 49.3 to 53.9.

Dollar index technical analysis
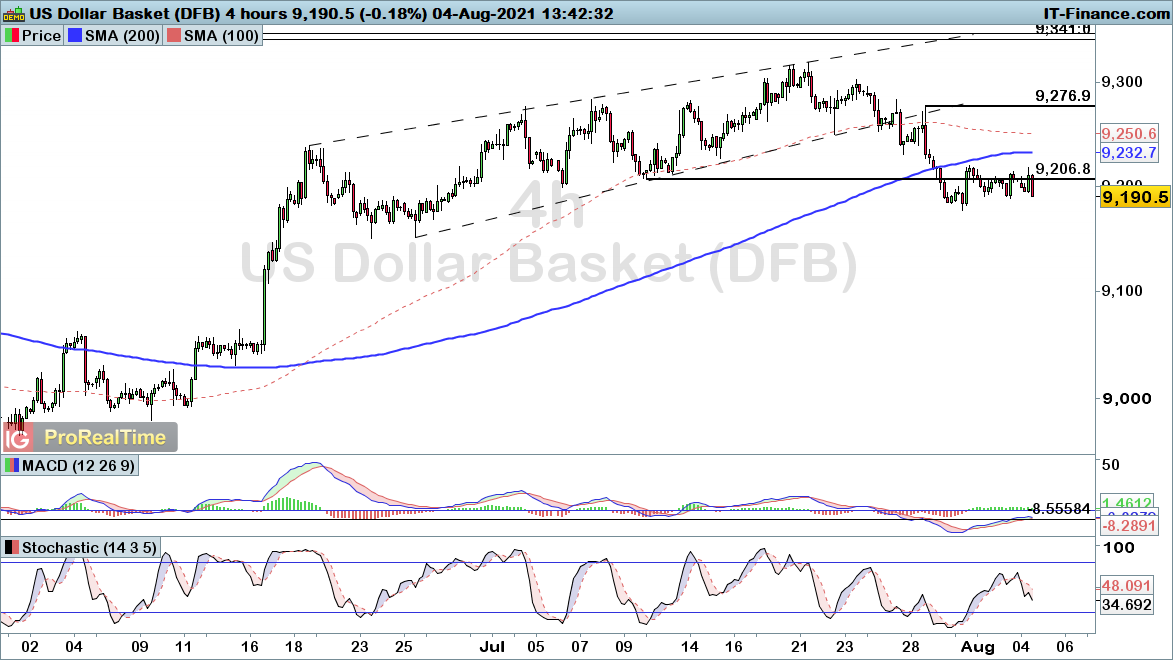
The dollar index has been hit hard of late, with the price falling back down through trendline and 92.06 support to end the uptrend seen throughout much of June and July.
While the price has been consolidating in the lead up to Friday’s jobs report, the lack of any significant uplift does highlight a growing possibility that price will soon break lower once again.
Of course we could see volatility in either direction. However, while an improvement to the jobs picture would likely drive the dollar, we would need to overcome 92.77 if things are to look more optimistic for the dollar.
S&P 500 technical analysis
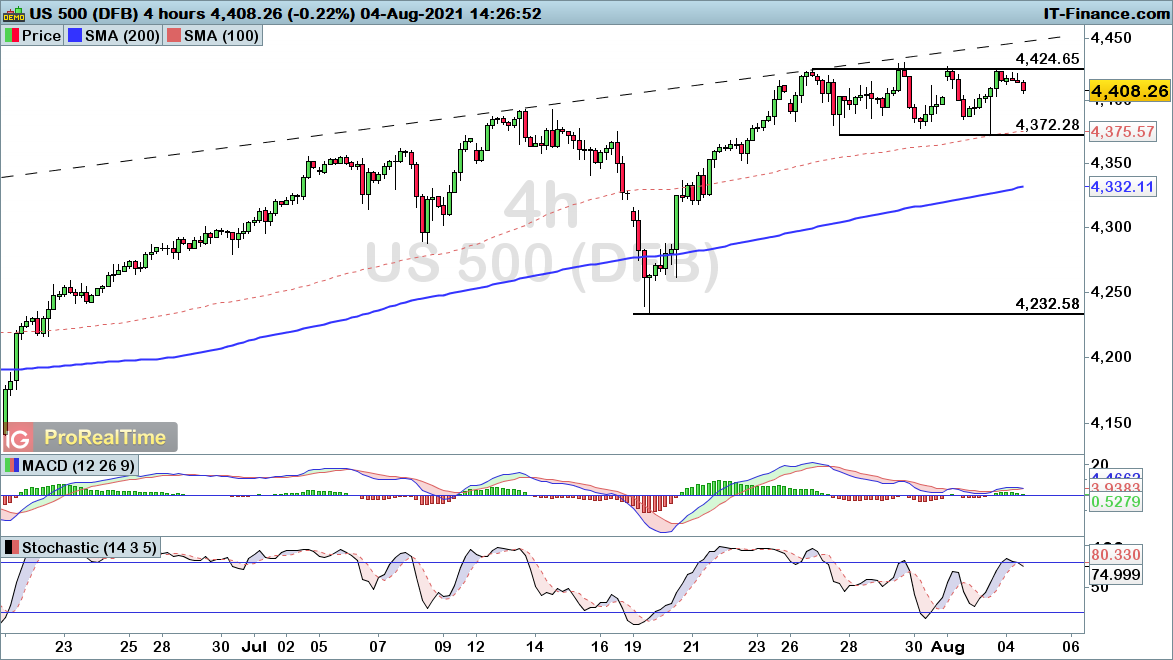
The S&P 500 remains within consolidation mode as we head towards the jobs report, with the price turning lower from 4424 once again. The breakout from this range will be important in gauging the direction of travel from here on in.
However, with a long-term uptrend in place, the bullish side of the story is always favoured. Thus while a break below 4372 would signal a potential short-term period of weakness, it would simply look like a retracement of the wider rally from 4232 low.
This information has been prepared by IG, a trading name of IG Australia Pty Ltd. In addition to the disclaimer below, the material on this page does not contain a record of our trading prices, or an offer of, or solicitation for, a transaction in any financial instrument. IG accepts no responsibility for any use that may be made of these comments and for any consequences that result. No representation or warranty is given as to the accuracy or completeness of this information. Consequently any person acting on it does so entirely at their own risk. Any research provided does not have regard to the specific investment objectives, financial situation and needs of any specific person who may receive it. It has not been prepared in accordance with legal requirements designed to promote the independence of investment research and as such is considered to be a marketing communication. Although we are not specifically constrained from dealing ahead of our recommendations we do not seek to take advantage of them before they are provided to our clients.

Start trading forex today
Trade the largest and most volatile financial market in the world.
- Spreads start at just 0.6 points on EUR/USD
- Analyse market movements with our essential selection of charts
- Speculate from a range of platforms, including on mobile
Live prices on most popular markets
- Forex
- Shares
- Indices