Trading mistakes: blindly buying into a bull market
IG senior market analyst Axel Rudolph sits down with IGTV’s Angeline Ong to discuss why investors should not 'blindly buy into a bull market' and references the S&P 500, between 2000-2023.

(Video summary)
Blindly buying into a bull market
In this video series about trading mistakes, the focus is on a common error made by new traders: blindly purchasing stocks when the market is on an upward trend.
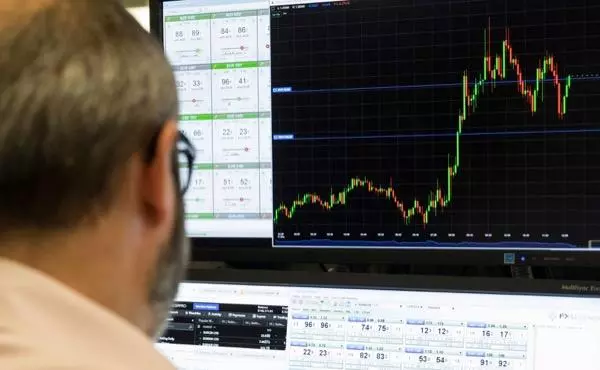
Senior market analyst Axel Rudolf explains why this can be a risky move and provides some helpful insights. Axel uses the example of the S&P 500 and shows a chart that illustrates a bear market from 2000 to 2003. He highlights how, within this bear market, there were two instances where the market experienced significant increases of over 20%. However, investors who bought during those times ultimately faced declines in the market.
No one-size-fits-all answer
Axel stresses the importance of not making decisions based solely on price percentages but instead analysing the chart, considering factors like volatility and momentum. When asked if there are specific indicators to consider before making a trading decision, Axel explains that there is no one-size-fits-all answer. However, he suggests a few indicators that can be useful. Some traders use Elliott Wave Theory, which involves identifying corrective moves against the main trend. In a bear market, this can indicate a potential continuation of the downside.
Other indicators to consider include declining momentum and overbought signals. Additionally, Axel mentions the usefulness of CNN's fear and greed index. If this index indicates extreme greed, it often precedes a significant correction.
The main takeaway from this video is that traders should exercise caution and avoid blindly buying into a bull market solely based on price increases. It is important to analyse the chart, evaluate indicators, and consider the overall market conditions before making well-informed trading decisions. By doing so, traders can avoid potential pitfalls and make smarter investment choices.
The information on this page does not contain a record of our trading prices, or an offer of, or solicitation for, a transaction in any financial instrument. IG Bank S.A. accepts no responsibility for any use that may be made of these comments and for any consequences that result. No representation or warranty is given as to the accuracy or completeness of this information. Consequently any person acting on it does so entirely at their own risk. Any research provided does not have regard to the specific investment objectives, financial situation and needs of any specific person who may receive it and as such is considered to be a marketing communication. Although we are not specifically constrained from dealing ahead of our recommendations we do not seek to take advantage of them before they are provided to our clients. See full non-independent research disclaimer.

Seize your opportunity
Deal on the world’s stock indices today.
- Trade on rising or falling markets
- Get one-point spreads on the FTSE 100, 1.2 on the Germany 40, and 0.4 on the US 500
- Unrivalled 24-hour pricing
See opportunity on an index?
Try a risk-free trade in your demo account, and see whether you’re on to something.
- Log in to your demo
- Try a risk-free trade
- See whether your hunch pays off
See opportunity on an index?
Don’t miss your chance – upgrade to a live account to take advantage.
- Get spreads from one point on the FTSE 100, 1.2 on the Germany 40, and 0.4 on the US 500
- Trade more 24-hour indices than any other provider
- Analyse and deal seamlessly on smart, fast charts
See opportunity on an index?
Don’t miss your chance. Log in to take your position.
Live prices on most popular markets
- Forex
- Shares
- Indices
Prices above are subject to our website terms and agreements. Prices are indicative only. All shares prices are delayed by at least 15 mins.
