Lukewarm CPI data sees risk environment recover: Silver, Straits Times Index, Brent crude, Energy sector
US equities managed to find its way higher following recent sell-off, as the S&P 500 VIX plunged 10.5% lower as a reflection of easing market fears. The US CPI data has been lukewarm at best.
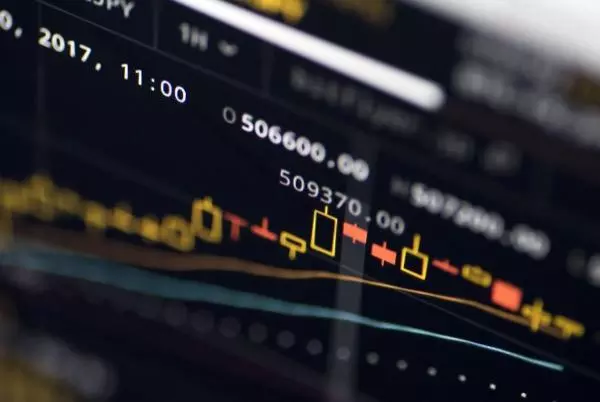

Market Recap
US equities managed to find its way higher following recent sell-off, as the S&P 500 VIX plunged 10.5% lower as a reflection of easing market fears. The US consumer price index (CPI) data has been lukewarm at best, with both core and headline inflation matching expectations on a year-on-year basis. However, core inflation is still revealing some persistence, having turned in higher-than-expected month-on-month (0.5% versus 0.4%). Apart from shelter costs, core services inflation remains elevated as well, with the deflationary factor coming from medical care costs once more.
The slow rate of descent in pricing pressures anchored the need for the Federal Reserve (Fed) to continue its hiking cycle, but at least for now, having not too huge of a surprise provides room for the Fed to move in more cautious 25 basis-point hikes while waiting for the dust in the banking space to settle. The Fed Fund futures reflect market pricing for an 80% probability of a 25 basis-point hike next week, before the hiking cycle concludes with the last 25 basis-point hike in May.
For markets that are trending in extreme fear just days ago, theat anchoring of less hawkish expectations provided some catalyst for risk sentiments to recover. There were also no new negative headlines of another bank or funds in trouble, which allows investors’ sentiments to settle down (until further cracks appear that is). Banks rallied after five straight days of losses. Two-year and ten-year Treasury yields bounced off their respective 200-day moving average (MA) on some inflation persistence, but the strength is not replicated in the US dollar which offers some resilience for gold and silver prices.
Silver prices are back to retest its key resistance at the US$22.00 level, following a bullish divergence on its Relative Strength Index (RSI). A move above US$22.00 could aid to support further upside to the US$22.90 level next, but with US yields being in the favour of US dollar strength for now, heavy resistance could be expected. Near-term support remains at the US$20.85 level, where a Fibonacci confluence support zone resides.

Asia Open
Asian stocks look set for a slightly positive open, with Nikkei +0.13%, ASX +0.34% and KOSPI +1.44% at the time of writing, with gains seemingly more measured compared to their US counterparts’ overnight performance. While some calm has returned, the renewed surge in bond yields as a result of further hikes seem to keep sentiments in check.
A series of China’s economic data will be in focus today. Optimism surrounding China’s reopening has been dampened recently, with a disappointing gross domestic product (GDP) growth guidance at the Two Sessions, while inflation and trade data have also pointed towards a more modest domestic recovery. Much will depend on the upcoming data to restore confidence, with expectations for China’s retail sales to move back into positive growth after three consecutive months of contraction. Industrial production may also see some recovery to 2.6% (from the previous 1.3%).
The recovery in the banking sector overnight may aid to underpin the Straits Times Index in today’s session, with technical conditions attempting to recover from oversold territory. The formation of a bullish hammer candlestick may be supportive of some near-term relief but for a sustained bullish trend, much still awaits as institutional investors pare their exposure over the past three weeks. A confirmation break above the 3,170 level may support an upmove to retest the 3,230 level, but a series of resistance may keep any formation of a lower high on watch.

On the watchlist: XLE finding resistance at double-top neckline, Oil prices broke below trendline support
Despite the broad-based recovery in the risk environment, oil prices failed to find the way higher overnight, potentially with some lingering concerns of longer-term economic demand. Following the shockwaves from Silicon Valley Bank, the US inflation data anchored the need for more tightening ahead, albeit in smaller-scale hikes. Brent crude has broken below an upward trendline support, overturning the higher lows narrative and leaving its December 2022 bottom in sight. Prices seem to be forced into a phase of consolidation, with the US$82.50 level as near-term resistance to overcome.

The Energy Select Sector SPDR ETF managed to recover 0.88% overnight, but having still traded below the neckline of a double-top formation, it is too early to put on a bullish view. The US$82.40 level will be a key resistance to overcome ahead, with the breakdown of the double-top formation suggesting that a retest of the US$70.87 level could still be on the table.

Tuesday: DJIA +1.06%; S&P 500 +1.65%; Nasdaq +2.14%, DAX +1.83%, FTSE +1.17%
The information on this page does not contain a record of our trading prices, or an offer of, or solicitation for, a transaction in any financial instrument. IG Bank S.A. accepts no responsibility for any use that may be made of these comments and for any consequences that result. No representation or warranty is given as to the accuracy or completeness of this information. Consequently any person acting on it does so entirely at their own risk. Any research provided does not have regard to the specific investment objectives, financial situation and needs of any specific person who may receive it and as such is considered to be a marketing communication. Although we are not specifically constrained from dealing ahead of our recommendations we do not seek to take advantage of them before they are provided to our clients. See full non-independent research disclaimer.

Act on share opportunities today
Go long or short on thousands of international stocks with CFDs.
- Get full exposure for a comparatively small deposit
- Trade on spreads from just 0.1%
- Get greater order book visibility with direct market access
See opportunity on a stock?
Try a risk-free trade in your demo account, and see whether you’re on to something.
- Log in to your demo
- Take your position
- See whether your hunch pays off
See opportunity on a stock?
Don’t miss your chance – upgrade to a live account to take advantage.
- Trade a huge range of popular stocks
- Analyse and deal seamlessly on fast, intuitive charts
- See and react to breaking news in-platform
See opportunity on a stock?
Don’t miss your chance. Log in to take your position.
Live prices on most popular markets
- Forex
- Shares
- Indices
Prices above are subject to our website terms and agreements. Prices are indicative only. All shares prices are delayed by at least 15 mins.
