Asia Day Ahead: Countdown to US CPI begins, Brent crude hover at upper channel resistance
A relatively quiet economic front overnight saw major US indices drift higher, reflecting broad expectations in place that the disinflation process in US will continue as intended.


Market Recap
A relatively quiet economic front overnight saw major US indices drift higher (DJIA +0.45%; S&P 500 +0.57%; Nasdaq +0.75%), reflecting broad expectations in place that the disinflation process in US will continue as intended. Rate-sensitive growth sectors led the way with strength in big tech, while appetite for risk-taking remains intact with the underperformance in defensive sectors, alongside another dip lower in the VIX. There were some pushback against overly dovish rate expectations from New York Federal Reserve (Fed) President John Williams, but markets remain focused on economic data to justify rate views as compared to Fed’s verbal cues lately.
Treasury yields were more indecisive however, trading in a tight range with the two-year yields ending the day roughly where it started. US 10-year yields were slightly higher by 1.5 basis point (bp), but mostly reflect wait-and-see ahead of the upcoming US consumer price index (CPI) release. Broad consensus is for US December headline inflation to come in higher at 3.2%, but for core inflation to ease to 3.8% from previous 4%. With the core aspect taking on greater focus, anything that matches or below 3.8% may potentially help to keep the market confidence going.
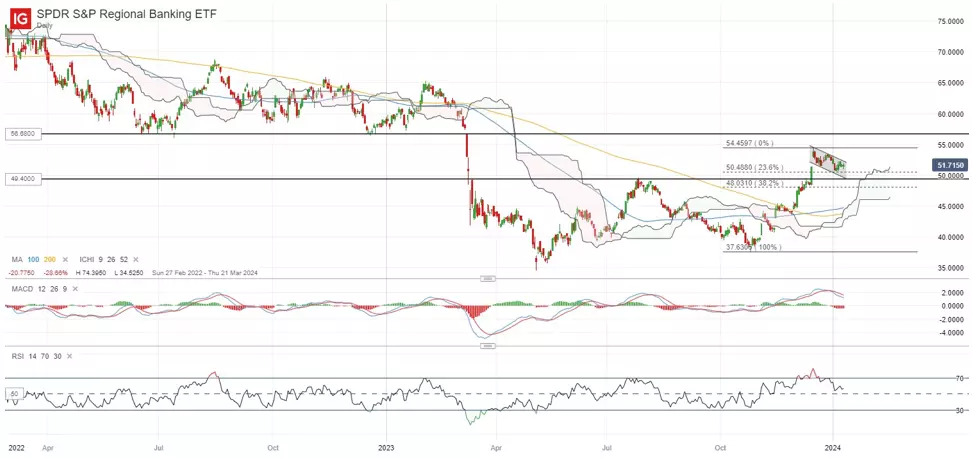
Major US banks’ earnings will be up on the radar this Friday as well, with stability of the banking sector and validation for soft landing hopes being the key market focus. A look at the SPDR S&P Regional Banking ETF revealed a potential bullish flag formation in place, with recent price moves trading on a near-term channel with a hover above the 23.6% Fibonacci retracement. Any decisive move above the channel may signal a continuation of the prevailing upward trend, potentially leaving its December 2023 high on watch for a retest.
Asia Open
Asian stocks look set for a positive open, with Nikkei +1.81%, ASX +0.40% and KOSPI +0.15% at the time of writing. The Nikkei continues to extend its gains, following a recent break to a new multi-decades high above the 33,700 level of resistance. Sentiments are also finding comfort that subdued wage data and weaker household spending presented this week offer room for the Bank of Japan (BoJ) to maintain its ultra-accommodative policies for longer.
South Korea’s interest rate decision may warrant some focus, with the central bank keeping its policy rate unchanged at 3.5% for an eighth consecutive meeting as widely expected. Easing inflation and higher economic risks presented over the past months validate the current policy decision, but a pivot to rate cuts is still priced to be sometime out (3Q 2024, as priced by interest rate futures).
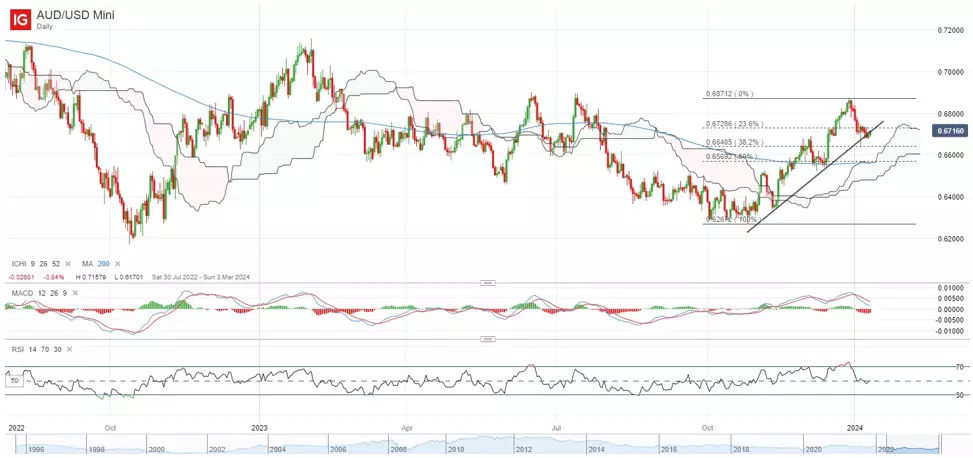
While the wait for US inflation data continues, some attention may be on the AUD/USD, which continues to hang around a crucial trendline support. A bullish cue may come from any move back above the 0.673 level, where the 23.6% Fibonacci retracement serves as a level of resistance to start the new year. Failure to hold the trendline support could see the pair head to retest the 0.664 level next, where dip-buying was sighted on 5 January 2024 with the formation of a bullish pin bar.
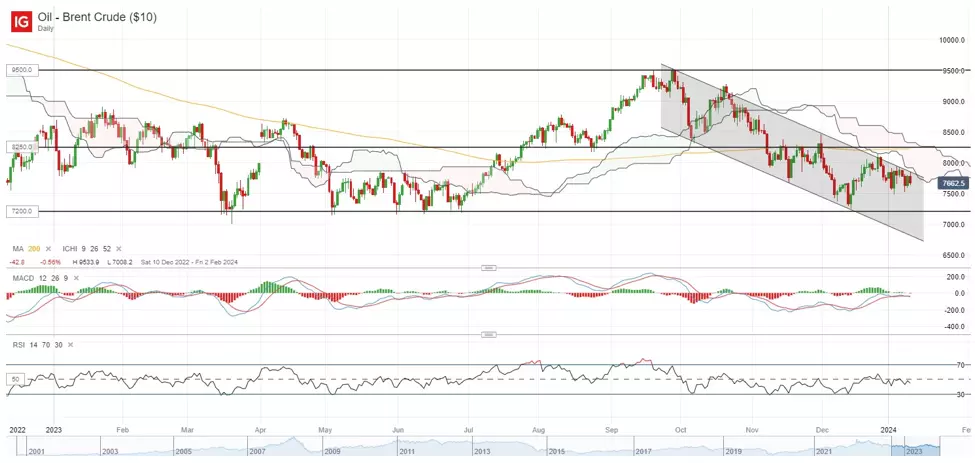
On the watchlist: Brent crude prices finding near-term resistance at upper channel trendline
Oil prices have been trading within a descending channel pattern on lower highs and lower lows since September 2023, with recent moves attempting for a break of the upper channel resistance but failed to find the much-needed success just yet. A series of resistance overhead remains in the way for buyers to tackle as well, which includes the Ichimoku cloud resistance on the daily chart and its 200-day moving average (MA).
Ahead, greater conviction for buyers may come from an upward break of the channel and for its daily relative strength index (RSI) to revert above the 50 level. A move above channel resistance may pave the way to retest the US$82.50 level next. On the downside, the US$75.84 will serve as near-term support to hold, where its year-to-date low stands.
Wednesday: DJIA +0.45%; S&P 500 +0.57%; Nasdaq +0.75%, DAX +0.01%, FTSE -0.42%
The information on this page does not contain a record of our trading prices, or an offer of, or solicitation for, a transaction in any financial instrument. IG Bank S.A. accepts no responsibility for any use that may be made of these comments and for any consequences that result. No representation or warranty is given as to the accuracy or completeness of this information. Consequently any person acting on it does so entirely at their own risk. Any research provided does not have regard to the specific investment objectives, financial situation and needs of any specific person who may receive it and as such is considered to be a marketing communication. Although we are not specifically constrained from dealing ahead of our recommendations we do not seek to take advantage of them before they are provided to our clients. See full non-independent research disclaimer.

Act on share opportunities today
Go long or short on thousands of international stocks with CFDs.
- Get full exposure for a comparatively small deposit
- Trade on spreads from just 0.1%
- Get greater order book visibility with direct market access
See opportunity on a stock?
Try a risk-free trade in your demo account, and see whether you’re on to something.
- Log in to your demo
- Take your position
- See whether your hunch pays off
See opportunity on a stock?
Don’t miss your chance – upgrade to a live account to take advantage.
- Trade a huge range of popular stocks
- Analyse and deal seamlessly on fast, intuitive charts
- See and react to breaking news in-platform
See opportunity on a stock?
Don’t miss your chance. Log in to take your position.
Live prices on most popular markets
- Forex
- Shares
- Indices
Prices above are subject to our website terms and agreements. Prices are indicative only. All shares prices are delayed by at least 15 mins.
