外匯交易中的支撐位和阻力位是什麼?
在外匯市場交易時,支撐位和阻力位是技術分析的基石。探索如何利用外匯交易中的支撐位和阻力位。

What is support and resistance in forex?
Support is the area on the price chart that indicates traders’ willingness to buy. Resistance, on the other hand, is when the demand levels on the price chart exceed the supply.
Support happens when there’s a fall in the forex market that results in a downward trend when lower prices increase the likelihood of traders taking a long or ‘buy’ position. Once the demand rises and becomes equivalent to the level of supply in the market, the forex price will discontinue falling.
When market prices increase and supply exceeds demand there’s a high probability that you’ll want to take a short or ‘sell’ position instead of a long or ‘buy’ one. This is when resistance occurs. This could be because traders trading the forex market have decided the price is excessively high or they’ve reached their intended levels.
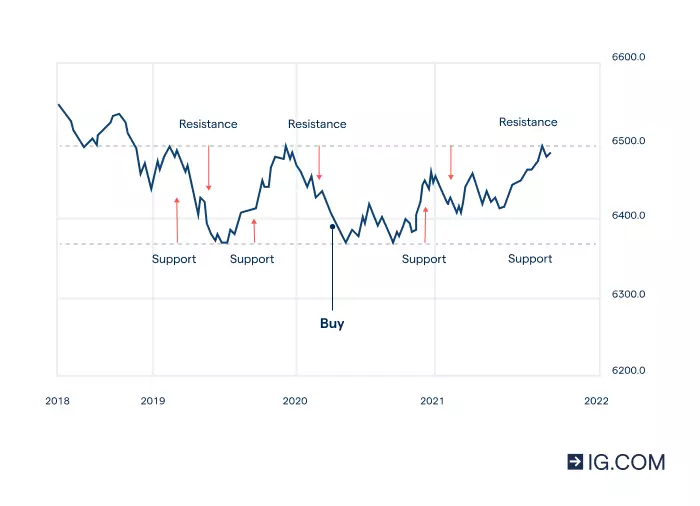
You can think of support as the floor and resistance as the ceiling of the forex price. Historical prices are the most reliable sources of support and resistance in forex. Notable levels typically come from significant peaks or troughs collected over time on the price charts. These are identified as zonal areas on the vertical axis.
As market prices reach the previous support or resistance in forex, they can either continue in the same price levels as before or move away from them until these ‘ceilings’ and ‘bottom’ occur again.
When a price level breaks through support, resistance forms. To get the bigger picture of the forex price movement, it’s important to look at the overall trends over time. For example, the chart shows historical trends from 2019 to 2022 with a resistance level or ‘ceiling’ of 6500 and a support or ‘bottom’ price of 6375.
Understanding the role of support and resistance is crucial to being able to recognise where you may want to place your stop losses, which is key to successful trading. Being able to gauge which levels should be of importance and the reaction of price to those levels will tell you a lot about how strong the trend is and what market sentiment is for the forex market.
It’s important to keep in mind that support and resistance in forex are the building blocks in technical analysis. Technical analysis is the use of chart patterns, trends in market movement and historical data to make some assumptions on trading.
Other than specific horizontal price points, technical indicators and trendlines can provide moving support or resistance levels that show how the forex chart moves over time.
Learn more about styles, strategies and trading plans with IG Academy’s range of online courses
How to identify and trade trendlines
Trendlines can be identified by monitoring the opening and closing price of the underlying asset as well as the trading range of individual candlesticks. Trendlines are used by traders in technical analysis. This is done by drawing lines that link together prices on a chart, which can either give an upward or downward pattern that’s indicative of market sentiment.
Resistance levels occur when there’s an upward trend in the market and the price decreases and moves towards the trendline. On the hand, support levels form when there’s a downward trend in the market and the prices move towards the trendline.
There are three trend trading strategies – upward, downward and sideways trendlines. These can provide some foresight that can help you identify trends early-on so you can exit the forex market before it heads on a reverse trajectory.
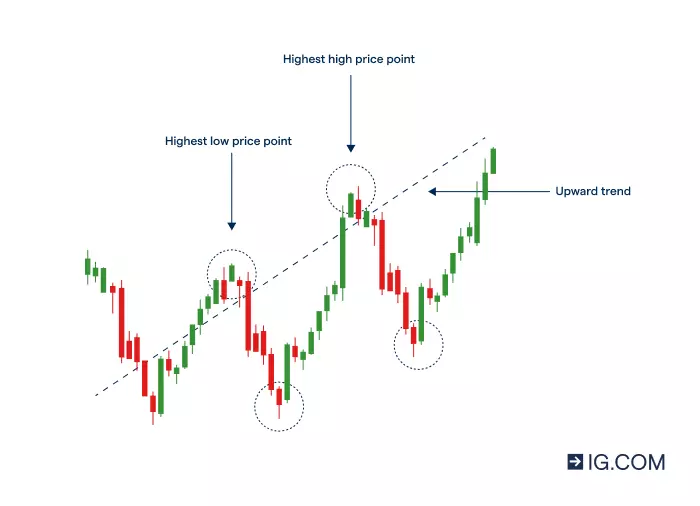
Upward trendline
When you see an upward trendline, this means the price of the forex pair is increasing in value. This means that the highs and lows of the individual candlesticks are relatively higher along the forex price movement’s trendline. When trading, you could take advantage of this by opening a long position as the market price levels keep reaching higher heights.
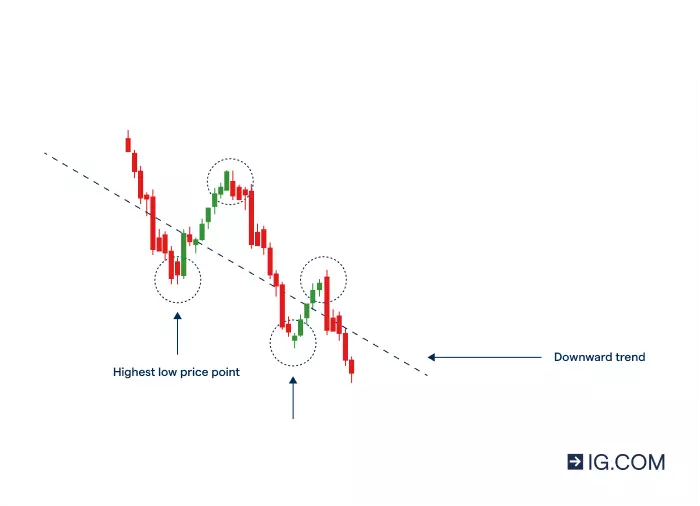
Downward trendline
A downward trendline is when there’s a decrease in the price of the forex pair. These would occur when the candlesticks highs and lows are relatively lower along the forex price movement’s trendline. In an instance like this, you could open a short position when the forex market price falls to lower levels.
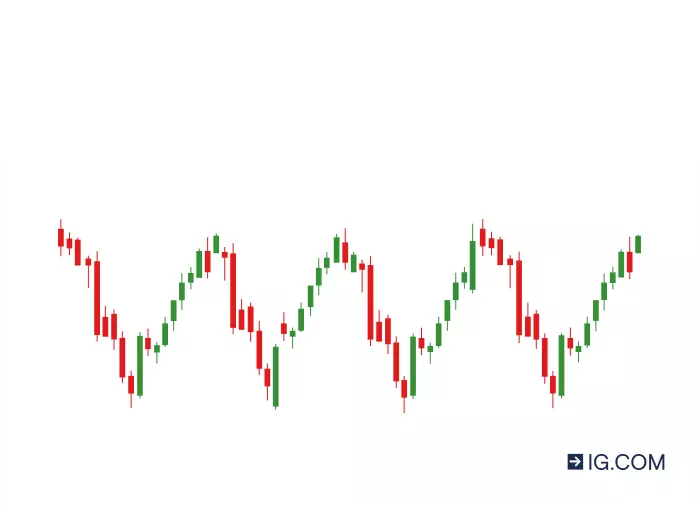
Sideways trendline
A sideways trendline is when the forex market price isn’t reaching higher or lower price points. This will most likely only interest you if you’re a scalper, as this would mean you’d be interested in short-term market movements vs the long-term trends, which are preferred by most traders.
How to use round numbers and moving averages
You can use round numbers and moving averages to help you understand the technical analysis used to read price charts when trading forex.
Round numbers
Round numbers are a common feature of support and resistance in the forex market. This is because the forex market price will likely have a challenge moving above a round number.
If you’re a beginner trader, don’t fall into the trap of taking a long or short position when the forex pair’s price is presenting as a round number, as this may not work in your favour.
Round numbers tend to create strong barriers to the forex price. Many banks and retail investors prefer to use round numbers, they also place those types of orders in large amounts, creating resistance in the forex market.
Moving averages
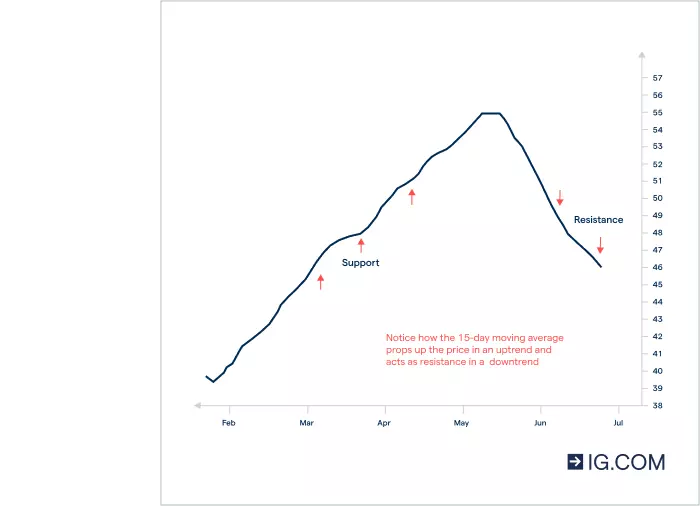
Moving averages (MAs) are delayed indicators, meaning they move slower than the forex market price. They would therefore be considered as historic data since they’d inform you on past trends instead of future ones. You’d use MAs if you’re a trend trader, since they’d inform you if the forex market were heading either upwards, downwards or sideways.
If you’re looking at a single MA, you’d focus on whether the price is above or below the delayed indicators. If the price is above the MA, it indicates an uptrend and if below, it’s likely a downtrend. You can also use the crossover between two MAs as a sign of the direction change in the forex pair’s price.
These usually present as two exponential moving averages (EMAs) where one is fast and another slow. As a trend trader, you’d take a long position when the fast EMA crosses the slow one from below. Alternatively, you’d take a short position when the fast EMA crosses the slow one from above.
Learn more about trading styles
How to trade on forex support and resistance levels
- Choose currency pair to trade using CFDs
- Create a CFD account or practise on a demo
- Decide whether to ‘buy’ or ‘sell’
- Take steps to manage your risk
- Open your first trade
- Monitor your position
Open a CFD trading account with us, and trade spot forex. CFDs are contract agreements used to exchange the differences in currency pair price from the time you open your position to the time you close it.
When trading forex via CFDs, you’ll have exposure to the full value of the underlying market but won’t own the physical currency. When the price moves in your favour, you’ll make a profit; and make a loss if it moves against you.
CFDs are leveraged derivatives. With leverage, you can increase your exposure to the forex market by paying an initial deposit – called margin – that’s a fraction of the full value of the underlying market.
Your profit or loss is calculated according to your full position size. Leverage will magnify both your profits and losses. It’s important to manage your risks carefully as losses can exceed your deposit. Ensure you understand the risks and benefits associated with trading leveraged products before you start trading with them. Trade using money you’re comfortable losing.
Spot forex
With us, you can buy or sell spot forex using CFDs. The forex exchange will occur at the same time that the trade is settled. Spot prices reflect the underlying forex market and have no fixed expiry.
Forex options
With us, you can trade forex options using CFDs, which will enable you to gain the right, but not the obligation, to buy and sell the foreign currency pair on a specified future date or expiry at a specific or ‘strike’ price.
What are support and resistance levels in forex trading summed up
- Support is the area on the price chart that indicates traders’ willingness to buy. Resistance, on the other hand, is when the demand levels on the price chart exceed the supply
- Trade trendlines can be identified by monitoring the opening and closing price of the underlying asset as well as the trading range of individual candlesticks
- Round numbers tend to create strong barriers to the forex price, ultimately causing resistance in the forex price movement
- Moving averages (MAs) are delayed indicators, meaning they move slower than the forex market price
- You can open a CFD account with us, and trade spot forex and options
本信息由IG提供,IG為IG International Ltd的商業名稱。除網站下方的聲明外,本網頁所含信息不包含IG(下稱:我公司)成交價格記錄,或我公司對任何金融產品的交易要約或詢價。依據本網頁所發布的信息以及所表達的意見行事所造成的一切後果,我公司不予承擔任何責任。我公司對所發布信息的准確性及完整性不作任何明確或隱含的保證。任何人依賴本網頁的任何信息、觀點以及數據行事須自行承擔全部風險。本網頁相關研究報告中所含信息沒有考慮到特定投資目的、財政狀況或任何閱讀人士的特殊需求。本網頁信息的發布沒有嚴格遵守與促進投資研究報告獨立性相關的法律法規要求,因此應僅被視為市場營銷交流行為。盡管我公司自身交易不會因提供投資意見而受到明確限制,但我公司無意利用相關信息較客戶的時間優先性而尋求利益。點擊此鏈接《非獨立研究報告免責聲明》,閱讀全文。

